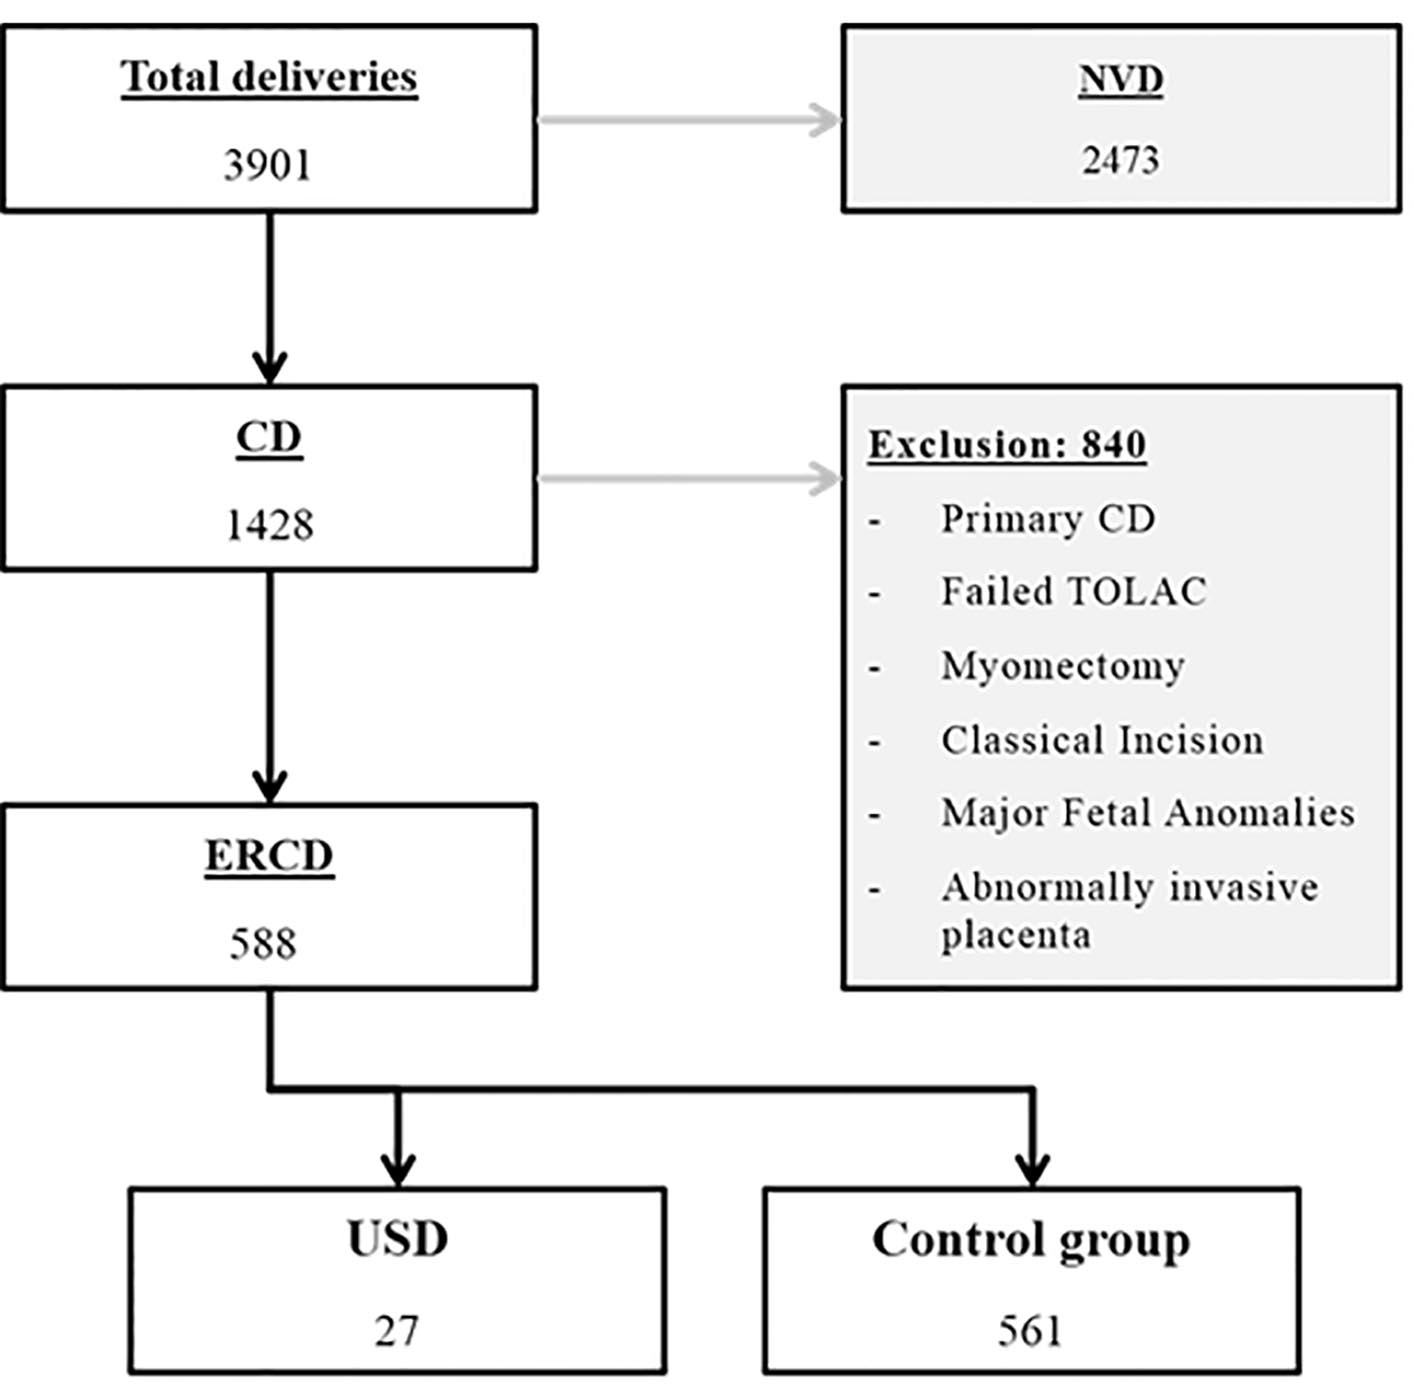
Figure 1. Flowchart of patients’ selection. CD: cesarean delivery; ERCD: elective repeat cesarean delivery; NVD: normal vaginal delivery; TOLAC: trial of labor after cesarean; USD: uterine scar dehiscence.
| Journal of Clinical Gynecology and Obstetrics, ISSN 1927-1271 print, 1927-128X online, Open Access |
| Article copyright, the authors; Journal compilation copyright, J Clin Gynecol Obstet and Elmer Press Inc |
| Journal website http://www.jcgo.org |
Original Article
Volume 7, Number 2, June 2018, pages 37-42
Incidence and Risk Factors of Uterine Scar Dehiscence Identified at Elective Repeat Cesarean Delivery: A Case-Control Study
Figure

Tables
| Variable | USD (N = 27) | Control (N = 561) | P value |
|---|---|---|---|
| CD: cesarean delivery; DM: diabetes mellitus; HDP: hypertensive disorders of pregnancy; USD: uterine scar dehiscence. Continuous variables expressed as means ± standard deviation, while categorical variables expressed as numbers (percentage). | |||
| Maternal demographics | |||
| Mean maternal age (years) | 28.4 ± 5.4 | 29 ± 5.5 | 0.6 |
| Mean parity | 2 ± 0.8 | 2.2 ± 1.5 | 0.52 |
| Smoking | 10 (37%) | 190 (34%) | 0.74 |
| Obstetrical history | |||
| Co-morbidity | |||
| DM or HDP | 3 (11.1%) | 48 (8.6%) | 0.65 |
| Bateman index > 2 [8] | 1 (3.7%) | 59 (10.5%) | 0.25 |
| Previous preterm birth | 4 (14.8%) | 49 (8.9%) | 0.3 |
| Current pregnancy | |||
| Gestational age (weeks) | 36.7 ± 1.8 | 37.6 ± 1.8 | 0.02 |
| Preterm delivery < 37 weeks | 9 (33.3%) | 85 (15.2%) | 0.012 |
| Tertiary CD or higher | 17 (63%) | 219 (39%) | 0.013 |
| Inter-delivery interval ≤ 24 months | 18 (66.7%) | 251 (45.1%) | 0.028 |
| Twin gestation | 1 (3.7%) | 15 (2.7%) | 0.75 |
| Labor | 0.29 | ||
| Yes | 14 (52%) | 233 (41.6%) | |
| No | 13 (48%) | 327 (58.4) | |
| Hospital stay (days) | 3.26 ± 3.6 | 2.5 ± 1 | 0.29 |
| Variable | USD (N = 6) | Control (N = 202) | P value |
|---|---|---|---|
| USD: uterine scar dehiscence. Categorical variables expressed as numbers (percentage). Data were collected from Makassed General Hospital. | |||
| Pain at the cesarean scar | 1 (16.7%) | 20 (9.9%) | 0.59 |
| Previous hysterotomy closure | 0.22 | ||
| Single layer | 2 (33.3%) | 17/116 (14.7%) | |
| Double layer | 4 (66.7%) | 99/116 (85.3%) | |
| Risk factor | OR | 95% CI | P value |
|---|---|---|---|
| Preterm delivery < 37 weeks | 2.76 | 1.183 - 6.42 | 0.019 |
| ≥ tertiary cesarean | 2.56 | 1.142 - 5.735 | 0.023 |
| Inter-delivery interval ≤ 24 months | 2.38 | 1.042 - 5.436 | 0.04 |
| Variable | USD (N = 27) | Control (N = 561) | P value |
|---|---|---|---|
| NICU: neonatal intensive care unit; USD: uterine scar dehiscence. Continuous variables expressed as means ± standard deviation and categorical variables expressed as numbers (percentage). | |||
| APGAR < 7 at 5 min | 1 (3.7%) | 10 (1.8%) | 0.47 |
| Asphyxia Neonatorum | 1 (3.7%) | 9 (1.6%) | 0.41 |
| Admission to NICU | 8 (29.6%) | 74 (13.2%) | 0.016 |
| Birth weight (g) | 2,812 ± 505 | 3,040 ± 504 | 0.022 |