Figures
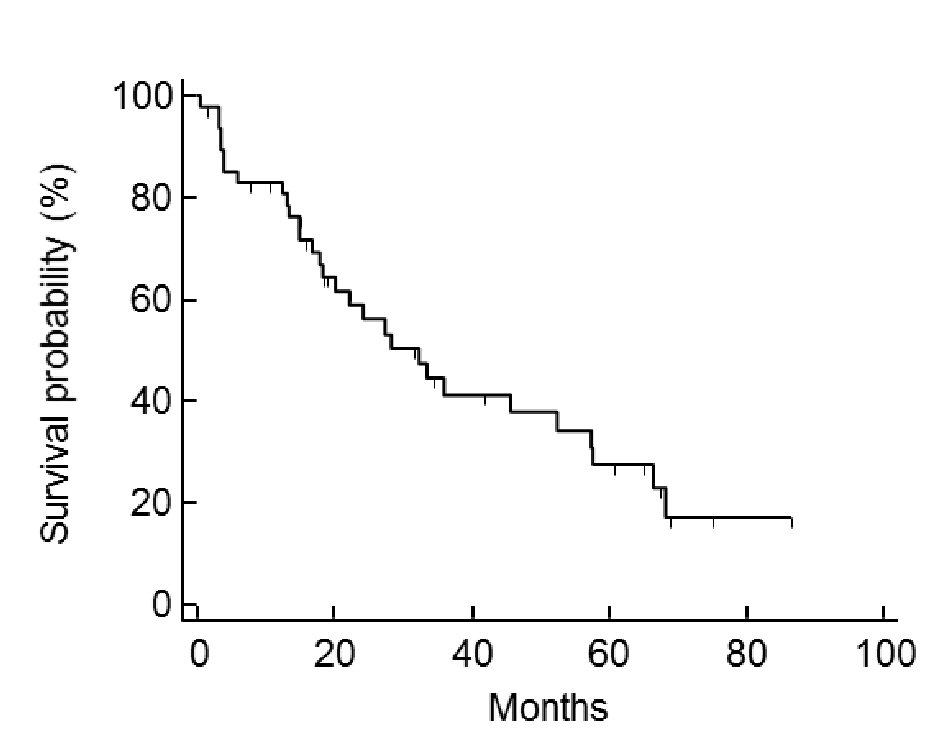
Figure 1. Case post-relapse survival. The median of post-relapse survival (PRS) was 32.3 months.
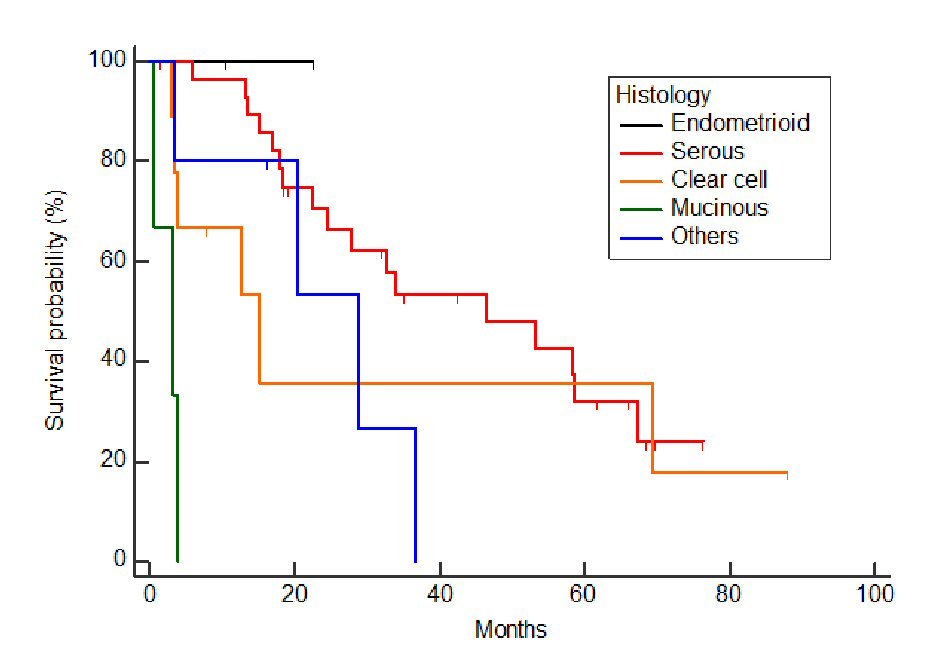
Figure 2. Relationship between histology and post-relapse survival. Tumor histology was significantly associated with PRS (P < 0.001). With the Bonferroni correction, there were significant differences in PRS recognized between serous adenocarcinoma and mucinous adenocarcinoma (P < 0.05).
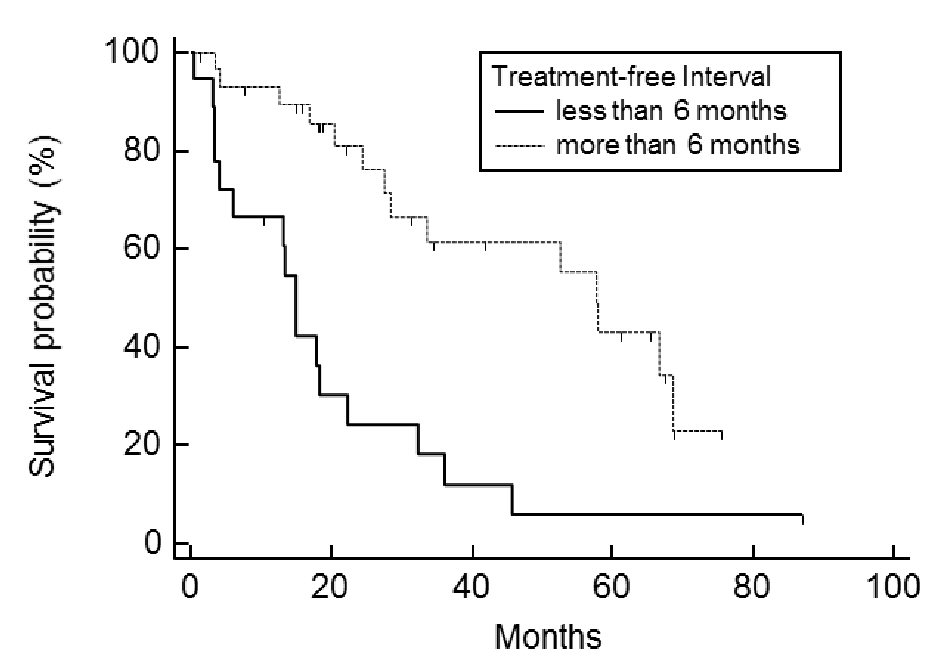
Figure 3. Post-relapse survival: comparison between treatment-free interval (TFI) of less or more than 6 months. Patients with a TFI of less than 6 months had a significantly worse prognosis than those with a TFI of more than 6 months (P < 0.001).
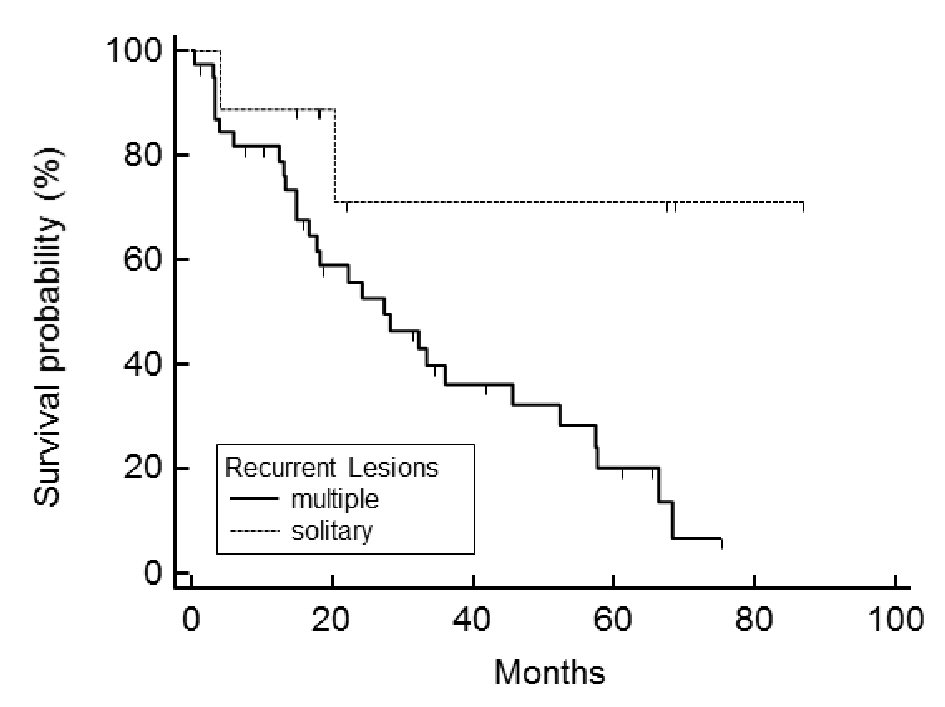
Figure 4. Post-relapse survival is related to the number of recurrent lesions. Patients with multiple recurrent lesions had a significantly worse prognosis than those with a solitary lesion (P = 0.029).
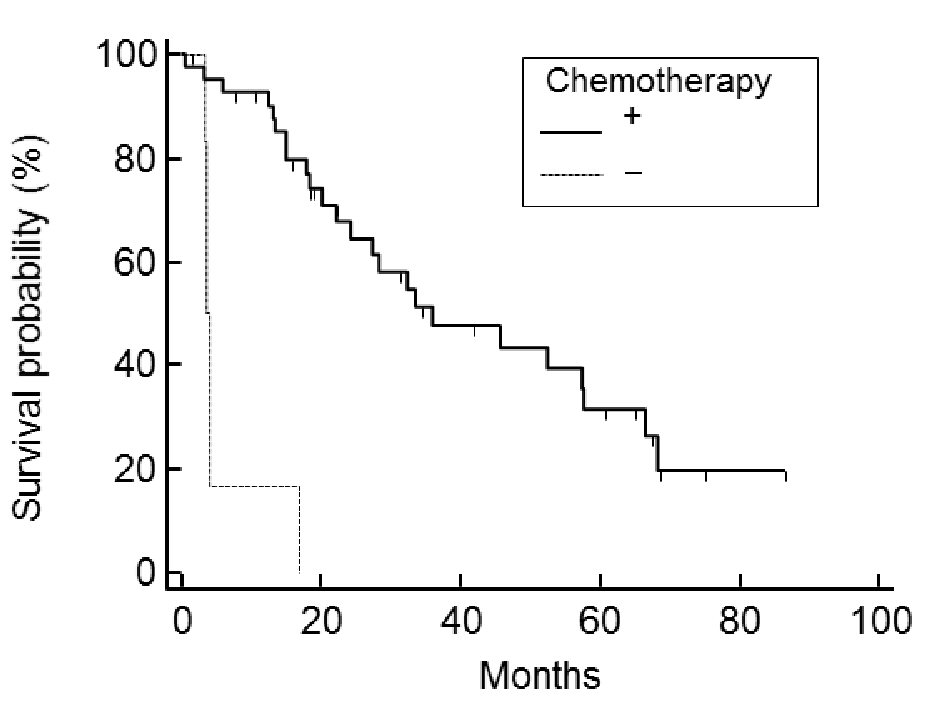
Figure 5. Post-relapse survival: comparison between the use and non-use of chemotherapy. Patients treated with chemotherapy showed significantly better prognosis than patients not treated with chemotherapy (P < 0.001). No trend was recognized between the number of chemotherapy regimens used and PRS.
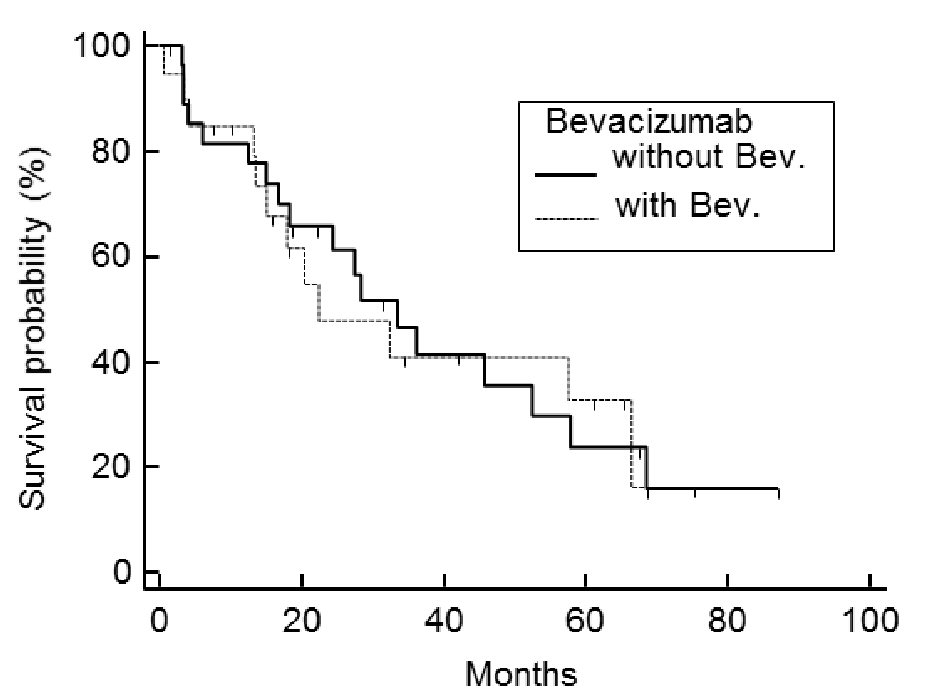
Figure 6. Post-relapse survival: comparison between chemotherapy with or without bevacizumab. Combining chemotherapy with bevacizumab does not improve PRS over chemotherapy-alone (P = 0.951).
Table
Table 1. Post-Relapse Survival: Multivariate Analysis With Cox Proportional Hazards Regression
| Covariant | Hazard ratio | 95% CI | P-value |
|---|
| TFI: treatment-free interval. |
| Mucinous histology | 15.091 | 1.314 - 173.2 | 0.029 |
| TFI within 6 months | 4.806 | 2.093 - 11.035 | 0.0002 |
| Solitary recurrent lesion | 0.126 | 0.025 - 0.631 | 0.011 |
| No chemotherapy | 9.092 | 1.850 - 44.67 | 0.007 |


