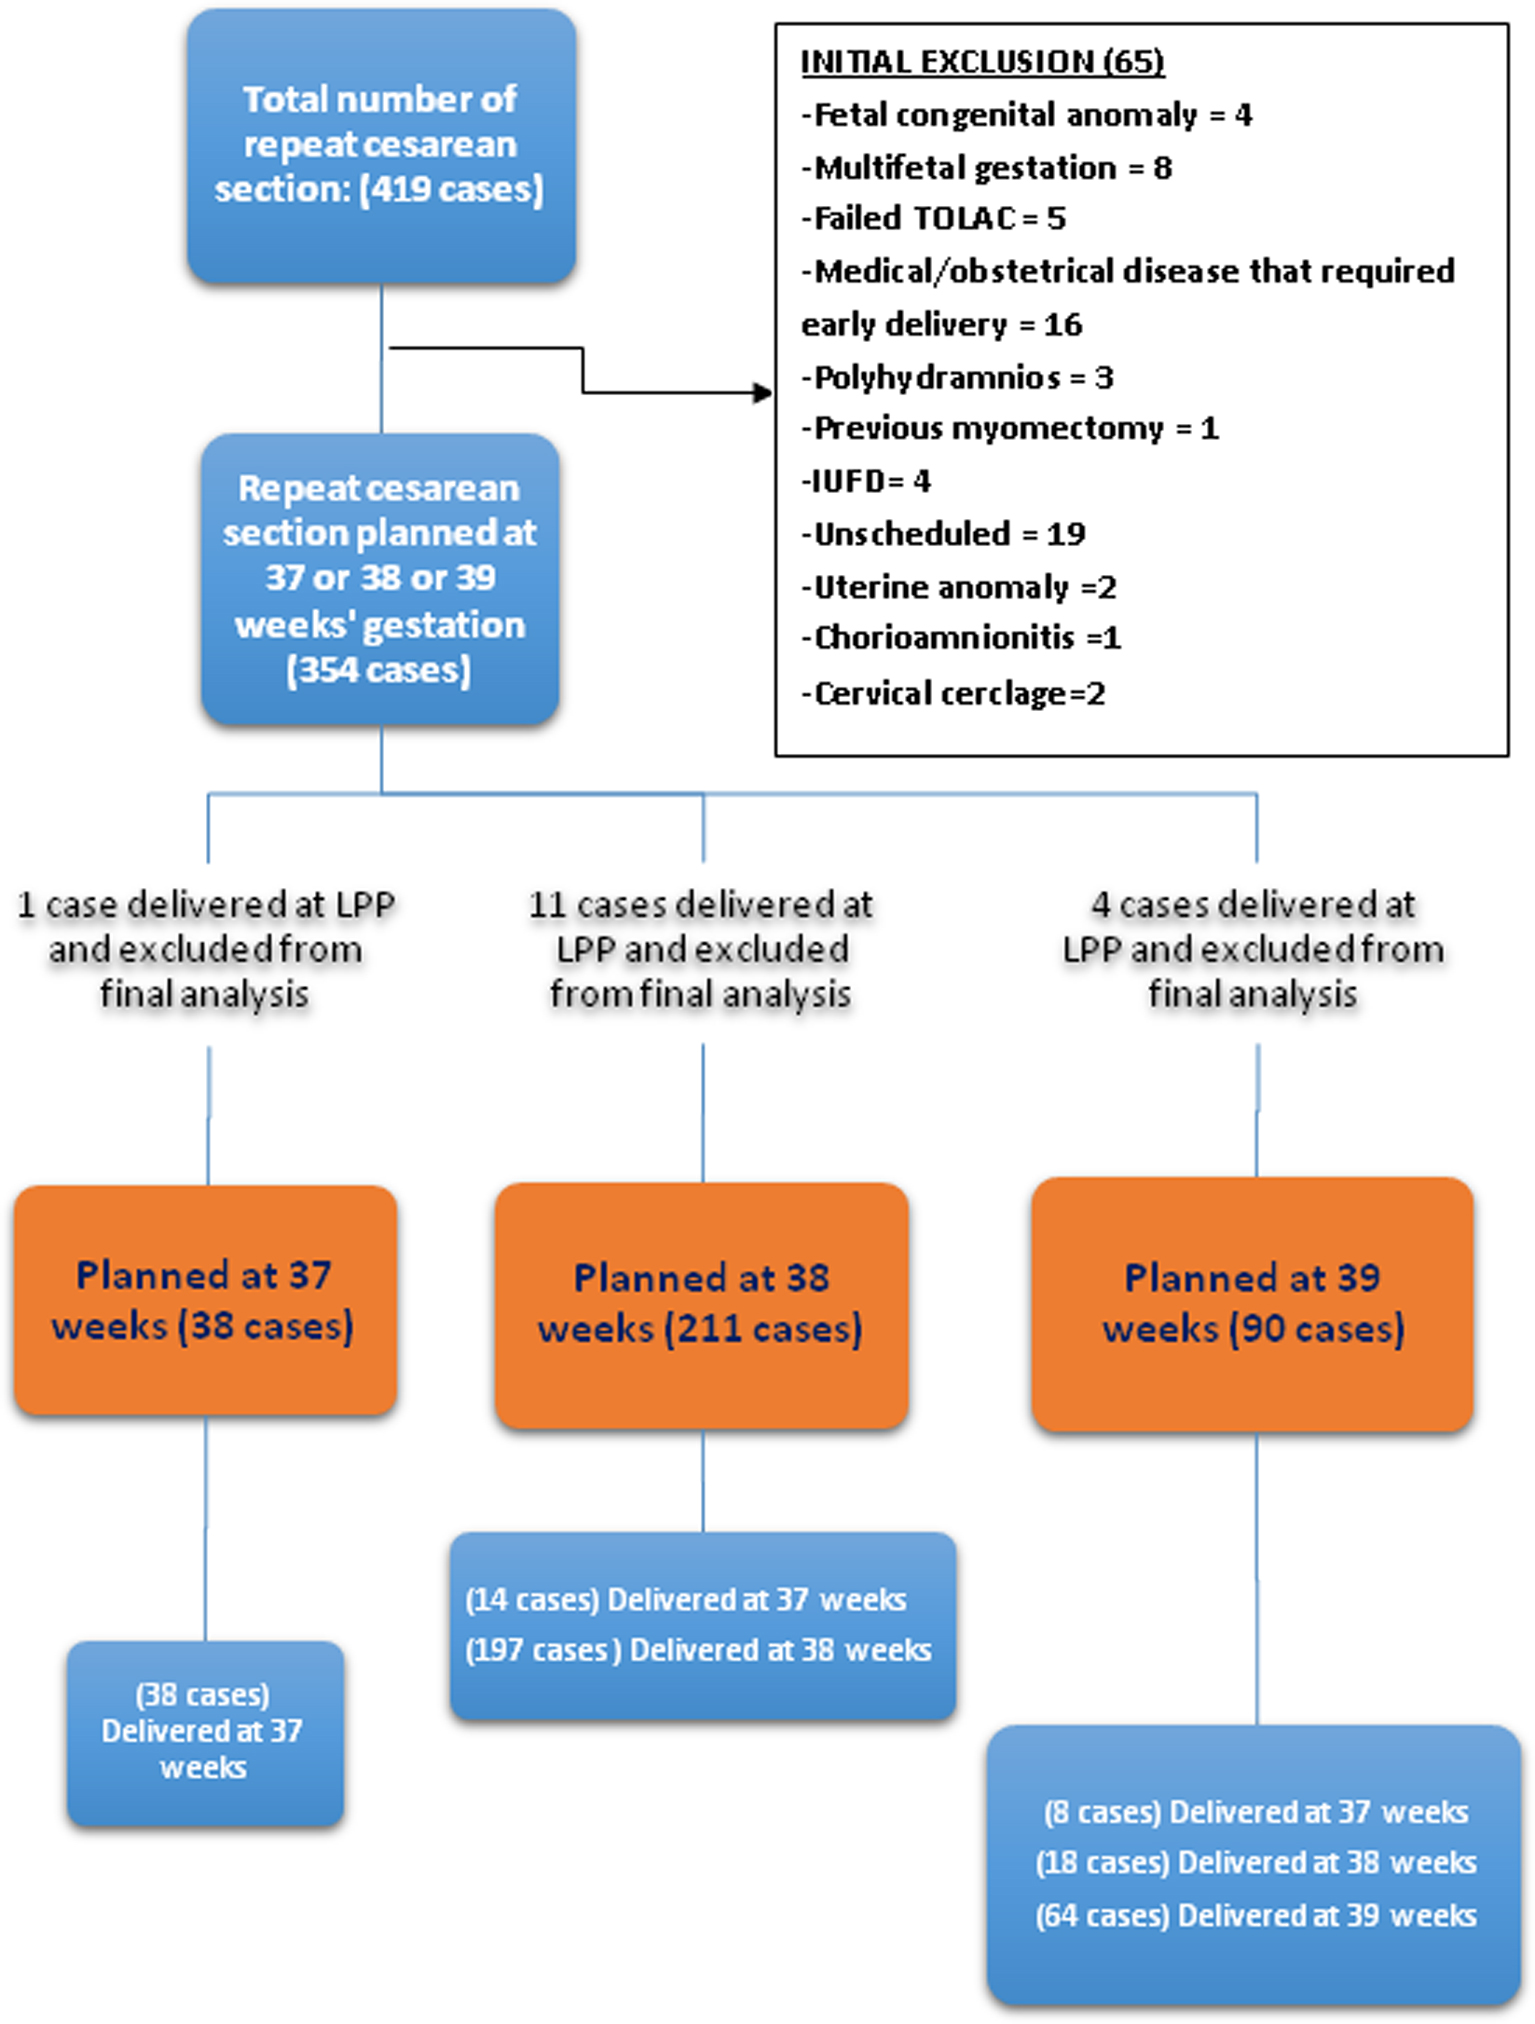
Figure 1. Study flow chart.
| Journal of Clinical Gynecology and Obstetrics, ISSN 1927-1271 print, 1927-128X online, Open Access |
| Article copyright, the authors; Journal compilation copyright, J Clin Gynecol Obstet and Elmer Press Inc |
| Journal website http://www.jcgo.org |
Original Article
Volume 8, Number 1, March 2019, pages 1-8
Timing of an Elective Repeat Cesarean Delivery at Term: Addressing the Controversy
Figures
Tables
| Scheduled at 39 weeks (90 cases) | Scheduled at 38 weeks (211 cases) | Scheduled at 37 weeks (38 cases) | P for trend | |
|---|---|---|---|---|
| Data are presented as mean ± standard deviation or number (percent). | ||||
| Maternal age (years) | 29.9 ± 4.8 | 30.1 ± 5.1 | 32.5 ± 5.5 | 0.019 |
| Mean parity | 1.5 ± 0.9 | 1.7 ± 1.0 | 2.3 ± 1.3 | 0.001 |
| Mean cesarean section order | 2.2 ± 0.6 | 2.4 ± 0.6 | 2.8 ± 0.7 | < 0.0001 |
| Co-morbidity | 9 (10.0%) | 30 (14.2%) | 9 (23.7%) | 0.128 |
| Diabetes mellitus | 5 (5.6%) | 12 (5.7%) | 2 (5.3%) | 0.994 |
| Smoker | 21 (23.3%) | 56 (26.5%) | 15 (40.5%) | 0.132 |
| Obesity | 10 (11.1%) | 44 (20.9%) | 13 (34.2%) | 0.009 |
| Previous preterm cesarean section | 3 (3.4%) | 6 (3.1%) | 2 (5.4%) | 0.772 |
| Male gender | 40 (44.4%) | 102 (48.3%) | 19 (50.0%) | 0.782 |
| Last cesarean section (months) | 36.1 ± 22.4 | 43.1 ± 27.0 | 41.5 ± 28.4 | 0.106 |
| Birth weight (g) | 3,038 ± 423 | 3,111 ± 439 | 2,967 ± 347 | 0.101 |
| Scheduling at 39 weeks (90) | Scheduling at 38 weeks (211) | Scheduling at 37 weeks (38) | P for trend | |
|---|---|---|---|---|
| Data are presented as mean ± standard deviation or number (percent). | ||||
| Non-elective delivery | 42 (46.7%) | 34 (16.1%) | 2 (5.3%) | < 0.0001 |
| Mean operative time (h) | 78.1 ± 20.4 | 79.1 ± 21.0 | 70.6 ± 20.3 | 0.069 |
| General anesthesia | 6 (6.7%) | 13 (6.2%) | 1 (2.6%) | 0.654 |
| Mean gestational age at delivery (weeks) | 38.6 ± 0.6 | 37.9 ± 2.4 | 37.0 ± 0.00 | < 0.0001 |
| Delivery at weekends | 10 (11.1%) | 7 (3.3%) | 1 (2.6%) | 0.016 |
| Delivery outside regular working hours | 37 (41.1%) | 22 (10.4%) | 2 (5.3%) | < 0.0001 |
| Delivery at night shift | 8 (8.9%) | 5 (2.4%) | 0 (0.0%) | 0.011 |
| Mean difference (schedule date to delivery date) (days) | 8.7 ± 4.8 | 5.9 ± 2.0 | 2.0 ± 0.64 | < 0.0001 |
| 39 weeks (n = 90) | 38 weeks (n = 211) | 37 weeks (n = 38) | P for trend | |
|---|---|---|---|---|
| Febrile morbidity | 7 (7.8%) | 15 (7.1%) | 0 (0.0%) | 0.221 |
| Thinning of lower segment | 13 (14.4%) | 22 (10.4%) | 2 (5.3%) | 0.293 |
| Dehiscence | 3 (3.3%) | 11 (5.2%) | 1 (2.6%) | 0.653 |
| Thinning/dehiscence | 16 (17.8%) | 33 (15.7%) | 3 (7.9%) | 0.359 |
| Any adverse maternal outcome | 11 (12.2%) | 28 (13.3%) | 1 (2.6%) | 0.172 |
| Neonatal intensive care unit (any cause) | 8 (8.9%) | 20 (9.5%) | 10 (26.3%) | 0.007 |
| Respiratory morbidity | 4 (4.4%) | 13 (6.2%) | 8 (21.1%) | 0.002 |
| Any maternal or neonatal adverse outcome | 15 (16.7%) | 44 (20.9%) | 11 (28.9%) | 0.290 |
| Scheduled at 39 weeksa | Scheduled at 38 weeks, RRb + CI (95%) | Scheduled at 37 weeks, RRb + CI (95%) | |
|---|---|---|---|
| aReferent standard against which other weeks were compared; b0.0% night-shift deliveries at 37 weeks. | |||
| Neonatal intensive care unit | 1.0 | 1.05 (0.57 - 1.94) | 1.30 (1.01 - 1.69) |
| Respiratory morbidity | 1.0 | 1.29 (0.54 - 3.087) | 1.40 (1.00 - 1.97) |
| Weekend delivery | 1.0 | 0.48 (0.31 - 0.74) | 0.97 (0.740 - 1.264) |
| Night-shift delivery | 1.0 | 0.46 (0.29 - 0.74) | NAb |
| Outside regular working hours | 1.0 | 0.35 (0.26 - 0.48) | 0.92 (0.80 - 1.05) |
| Non-elective cesarean section | 1.0 | 0.39 (0.28 - 0.53) | 0.88 (0.80 - 0.97) |
| P value | Odds ratio (OR) | 95% CI | |
|---|---|---|---|
| Maternal age | 0.835 | 1.018 | 0.962 - 1.077 |
| Parity | 0.176 | 0.787 | 0.509 - 1.216 |
| Cesarean section order | 0.393 | 1.444 | 0.767 - 2.718 |
| Obesity | 0.152 | 1.292 | 0.607 - 2.752 |
| Scheduled time (37 or 38 or 39 weeks) | < 0.0001 | 4.45 | 2.672 - 7.424 |