Journal of Clinical Gynecology and Obstetrics, ISSN 1927-1271 print, 1927-128X online, Open Access |
Article copyright, the authors; Journal compilation copyright, J Clin Gynecol Obstet and Elmer Press Inc |
Journal website https://www.jcgo.org |
Original Article
Volume 9, Number 3, September 2020, pages 43-52
Implementation of Enhanced Recovery in Gynecologic Surgery to Improve Outcomes at an Urban Safety-Net Hospital
Figures
Tables
Open surgery | Minimally invasive surgery | Vaginal surgery | |||||||
---|---|---|---|---|---|---|---|---|---|
Pre-ERP cohort (n = 42) | ERP Protocol (n = 19) | P value | Pre-ERP cohort (n = 32) | ERP Protocol (n = 25) | P value | Pre-ERP cohort (n = 22) | ERP protocol (n = 19) | P value | |
ERP: enhanced recovery pathway; BMI: body mass index; ASA: American Society of Anesthesiologists. | |||||||||
Age (year) | 48 (40 - 52) | 49 (40 - 59) | 0.86 | 47 (41 - 57) | 49 (40 - 57) | 0.97 | 58 (44 - 64) | 60 (43 - 62) | 0.55 |
BMI (kg/m2) | 28.8 (25.5 - 32.1) | 29.4 (26.1 - 32.7) | 0.78 | 32.4 (26.8 - 36.8) | 29.3 (25.7 - 33.6) | 0.13 | 29.4 (25.4 - 31.8) | 27.8 (23.2 - 33.9) | 0.90 |
ASA > 3 | 6 (14.3) | 7 (36.8) | 0.046** | 4 (12.5) | 4 (16.0) | 0.72 | 6 (27.3) | 6 (31.6) | 0.76 |
Open surgery | Minimally invasive surgery | Vaginal surgery | |||||||
---|---|---|---|---|---|---|---|---|---|
Pre-ERP cohort (n= 42) | ERP protocol (n = 19) | P value | Pre-ERP cohort (n = 32) | ERP protocol (n = 25) | P value | Pre-ERP cohort (n = 22) | ERP protocol (n = 19) | P value | |
The two-sample Student’s t-test and Wilcoxon’s rank sum test were used for continuous variables. Chi-square test and Fisher’s exact test were used for categorical variables. Data are presented as n (%) or median (interquartile range). *Statistical significance (P value < 0.05). ERP: enhanced recovery pathway; PACU: post-anesthesia care unit; TAP: transversus abdominis plane; h: hours. | |||||||||
Bupivacaine injection of surgical site (yes) | 17 (40.5) | 6 (31.6) | 0.51 | 32 (100) | 23 (92) | 0.19 | 2 (9.1) | 4 (21.1) | 0.39 |
TAP block if open | 2 (4.8) | 4 (21.1) | 0.69 | N/A | N/A | N/A | N/A | N/A | N/A |
Nonopioids used (yes) | |||||||||
Intraoperative | 21 (50) | 13 (68.4) | 0.18 | 20 (62.5) | 17 (68) | 0.67 | 6 (27.3) | 11 (57.9) | 0.047* |
PACU | 31 (73.8) | 6 (31.6) | 0.001* | 20 (62.5) | 7 (28%) | 0.009* | 13 (59.1) | 9 (47.4) | 0.45 |
Anesthesia time (h) | 4.1 (3.3, 4.6) | 4.1 (3.1, 5.9) | 0.65 | 5.4 (4.3, 6.6) | 4.6 (4.0, 5.6) | 0.15 | 3.9 (3.3, 4.7) | 5.2 (4.5, 5.7) | < 0.0001* |
Open surgery | Minimally invasive surgery | Vaginal surgery | |||||||
---|---|---|---|---|---|---|---|---|---|
Pre-ERP cohort (n = 42) | ERP Protocol (n = 19) | P value | Pre-ERP cohort (n = 32) | ERP protocol (n = 25) | P value | Pre-ERP cohort (n = 22) | ERP protocol (n = 19) | P value | |
The two-sample Student’s t-test and Wilcoxon’s rank sum test were used for continuous variables. The Chi-square test and Fisher’s exact test were used for categorical variables. Data are presented as n (%) or median (interquartile range). *Statistical significance (P value < 0.05). ED: emergency department; IV: intravenous; PACU: post-anesthesia care unit; UTI: urinary tract infection; ERP: enhanced recovery pathway. | |||||||||
Change in hemoglobin (g/dL) | -1.8 (-2.7, -0.7) | -1.1 (-1.9, -0.8) | 0.24 | -1.8 (-2.2, -1.4) | -1.5 (-2.3, -0.6) | 0.36 | -1.9 (-2.3, -1.4) | -1.4 (-3.2, -0.7) | 0.85 |
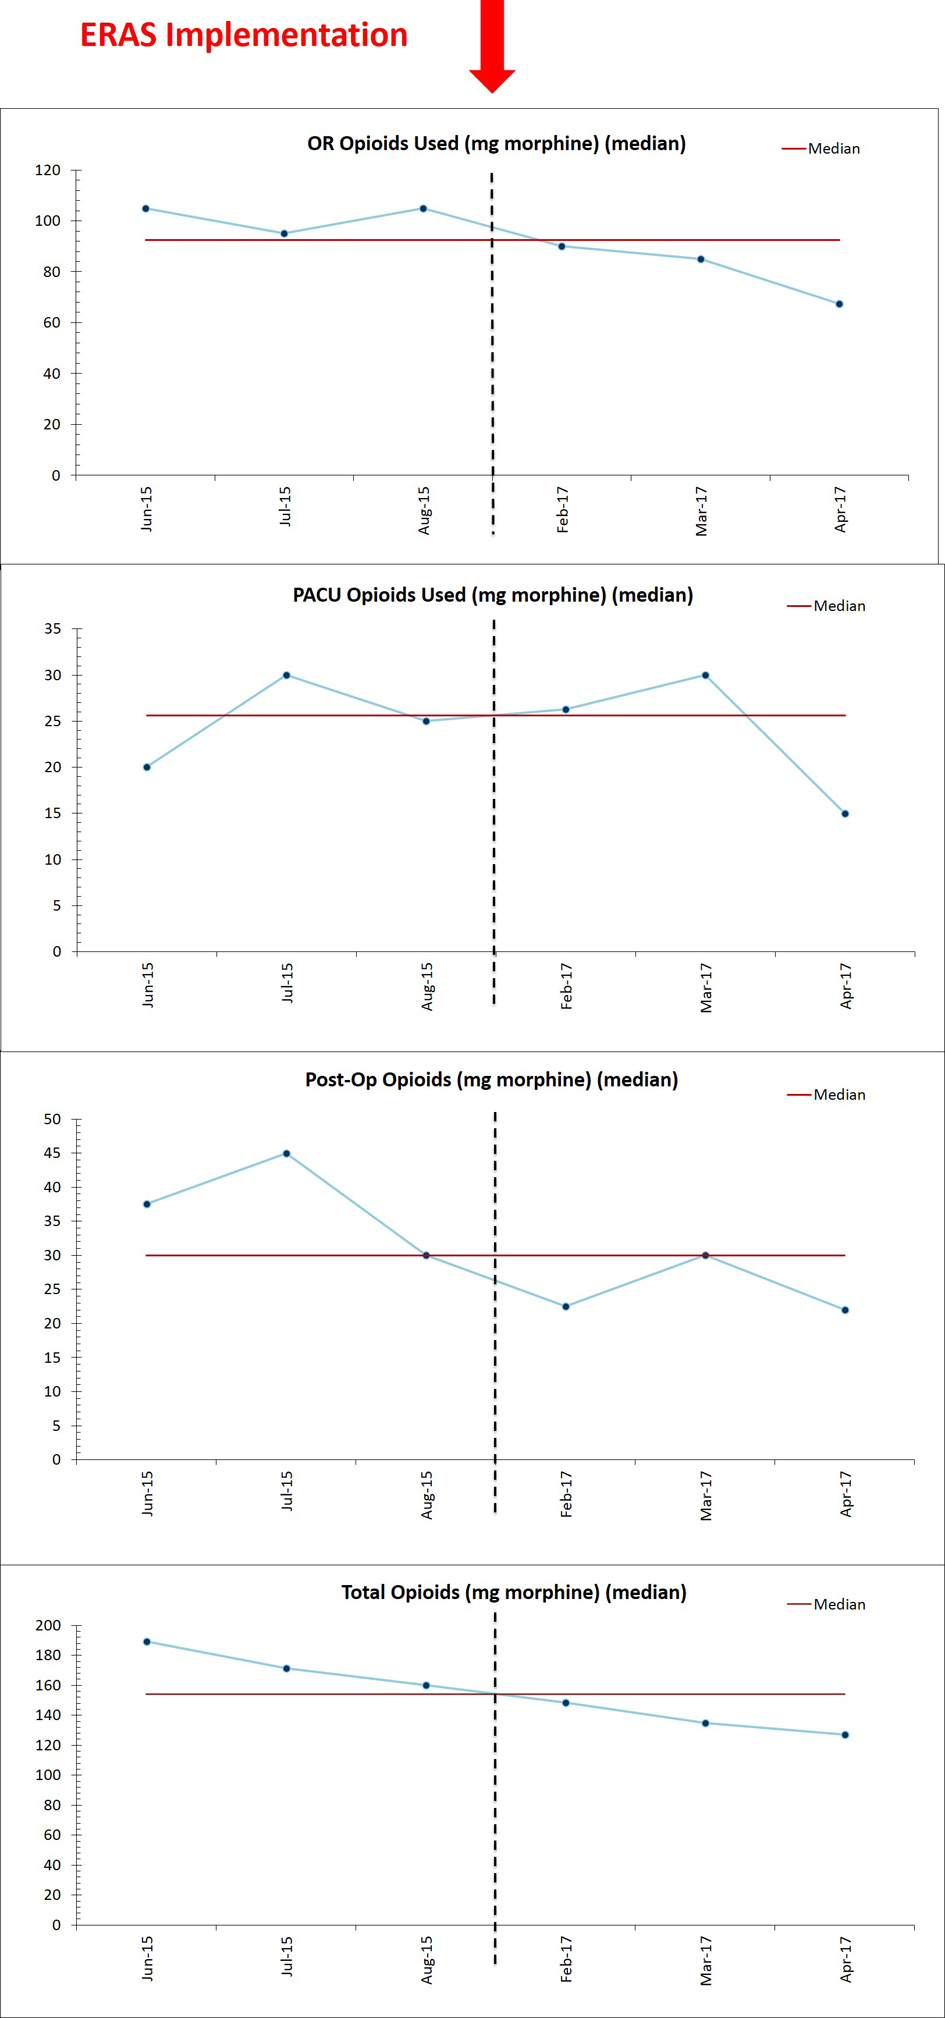
Total opioid use (mg) | 209.8 (170.5, 264) | 175.5 (75, 256.9) | 0.03* | 170.3 (125.5, 222.5) | 125 (105, 150) | 0.018* | 135.3 (112.5, 194) | 147 (123.8, 195) | 0.69 |
Intraoperative | 105 (85, 135) | 95 (45, 120) | 0.03* | 108.5 (89.5, 117.5) | 75 (60, 90) | < 0.0001* | 77.5 (60, 105) | 75 (60, 105) | 0.67 |
PACU | 28.5 (8.0, 46.5) | 30.0 (7.5, 37.5) | 0.39 | 15 (0, 25) | 15 (0, 52.5) | 0.36 | 22.5 (15, 50.5) | 27 (15, 60) | 0.86 |
Postoperative | 67.5 (48, 91.5) | 52.5 (15, 108.5) | 0.19 | 45 (15, 73.8) | 15 (0, 45) | 0.04* | 35.8 (15, 45) | 15 (7.5, 45) | 0.20 |
IV opioid used on inpatient floor (yes) | 30 (71.4) | 8 (42.1) | 0.03* | 4 (12.5) | 0 (0) | 0.12 | 3 (13.6) | 4 (21.1) | 0.68 |
Day 0 + 1 opioid use (mg) | 185.5 (154, 228.5) | 134.5 (75, 219.5) | 0.016* | 146.5 (125.3, 195) | 125 (105, 142.5) | 0.02* | 135.3 (110, 179) | 135 (123.8, 190) | 0.88 |
Length of hospital stay (h) | 54 (50.3, 57) | 57 (52, 101) | 0.12 | 29.1 (27.3, 31.8) | 31 (27, 34) | 0.41 | 31.4 (29, 36.3) | 29 (26, 31) | 0.04* |
Adverse events | |||||||||
30-day readmission | 3 (7.1) | 0 (0) | 0.55 | 1 (3.1) | 2 (8) | 0.58 | 3 (13.6) | 0 (0) | 0.24 |
ED visits | 5 (11.9) | 1 (5.3) | 0.66 | 1 (3.1) | 5 (20) | 0.08 | 5 (22.7) | 2 (10.5) | 0.42 |
UTIs | 3 (38) | 0 (0) | 0.09 | 4 (36) | 2 (17) | 0.91 | 4 (18.2) | 3 (15.8) | 1.0 |
Clavien-Dindo | |||||||||
Grade I | 2 (15.4) | 1 (50) | 0 (0) | 1 (14.3) | 2 (16.7) | 0 (0) | |||
Grade II | 3 (37.5) | 1 (50) | 0.44 | 6 (85.7) | 5 (71.4) | 0.58 | 9 (75) | 3 (100) | 0.63 |
Grade III+ | 4 (30.8) | 0 (0) | 1 (14.3) | 1 (14.3) | 1 (8.3) | 0 (0) |