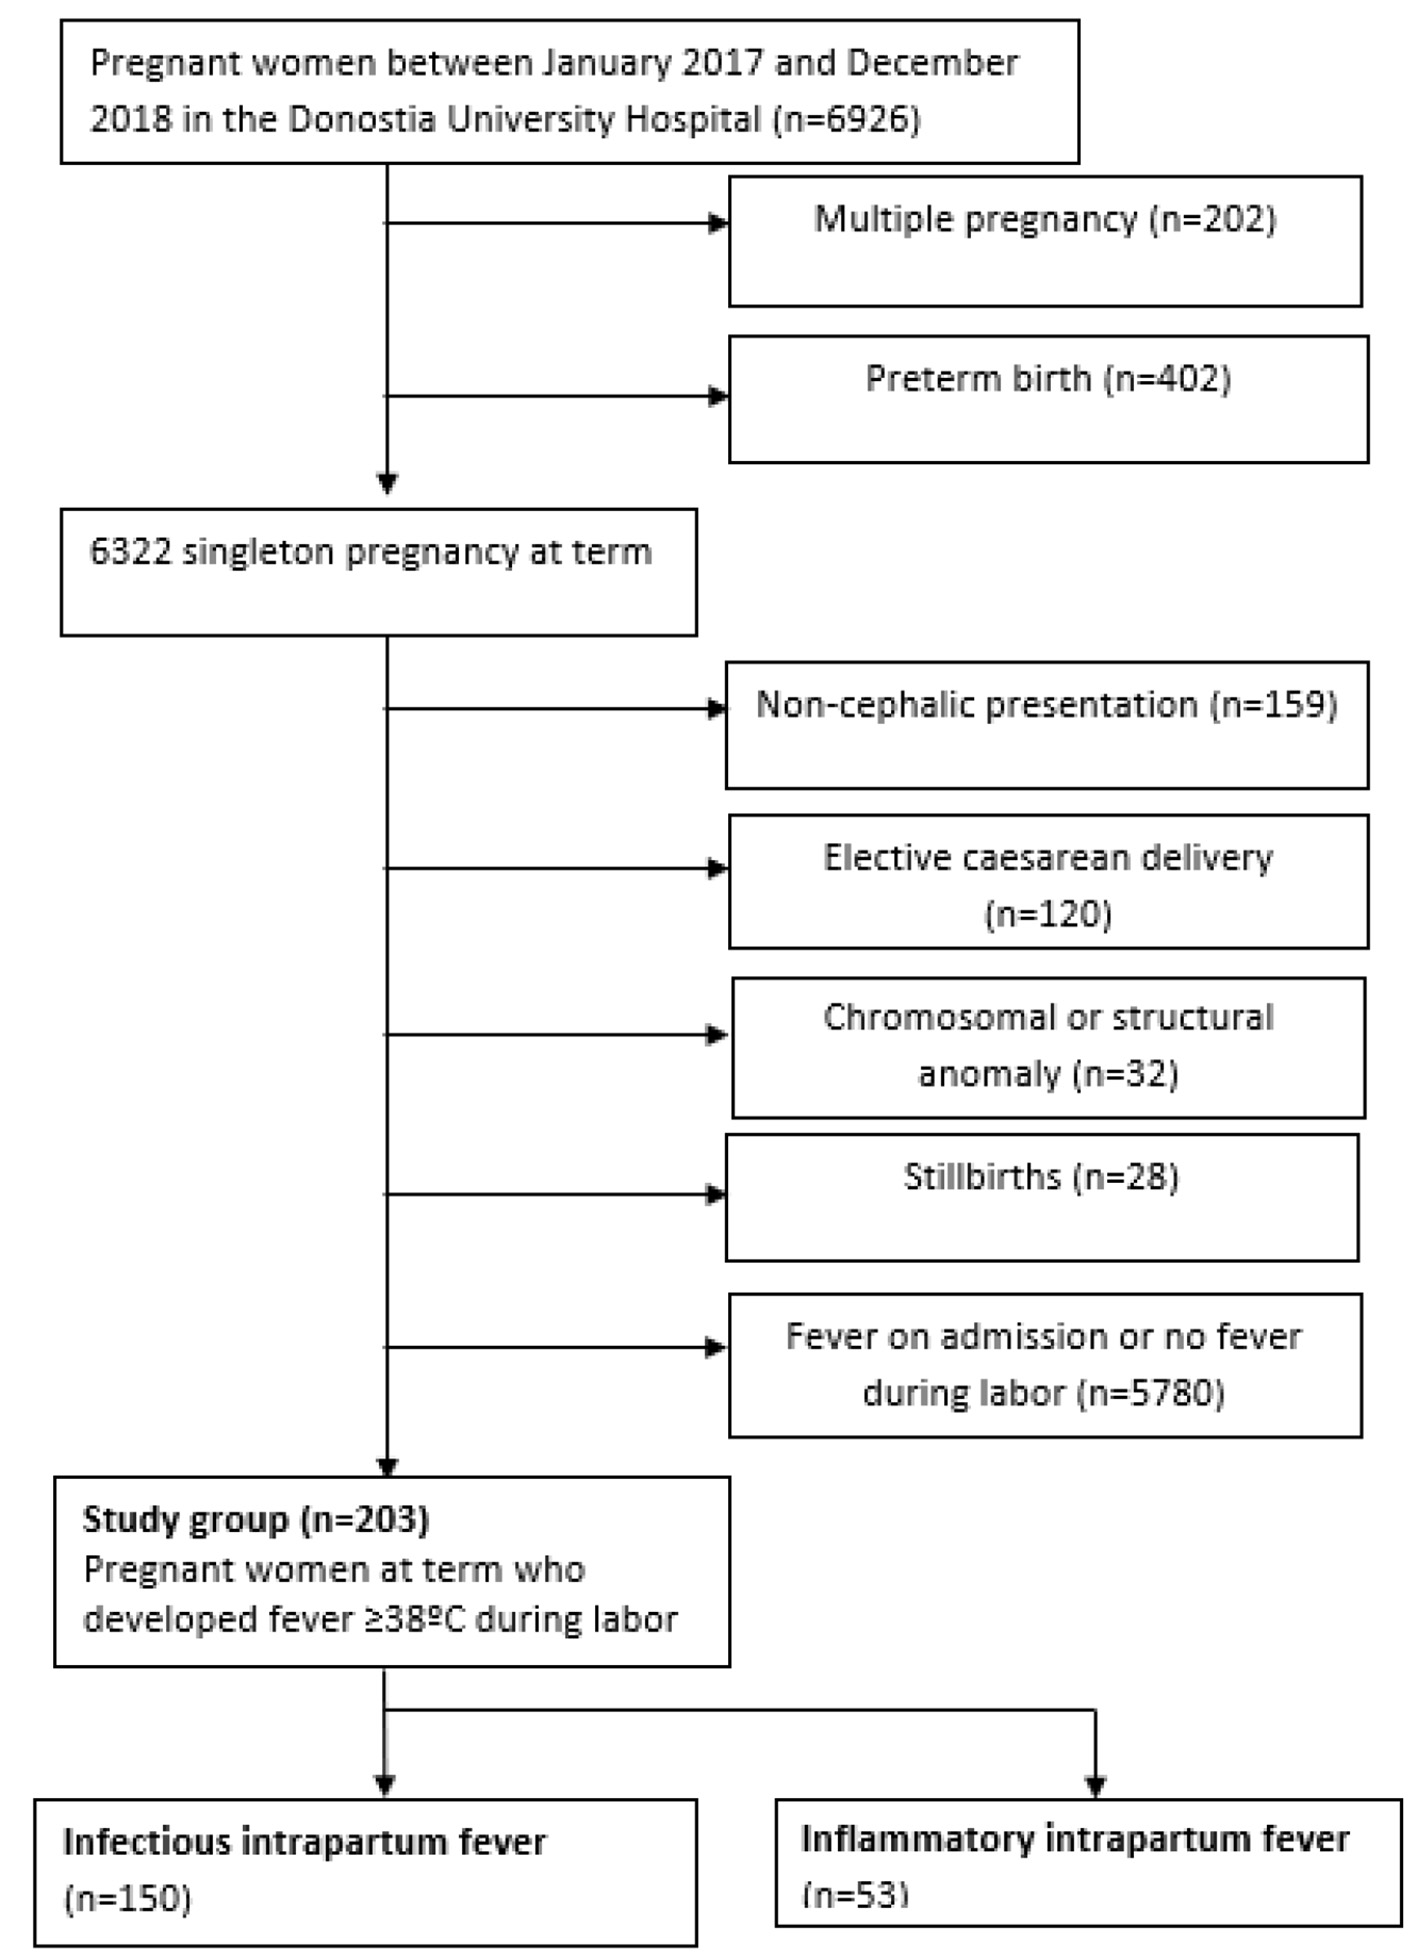
Figure 1. Flow chart of the study group.
| Journal of Clinical Gynecology and Obstetrics, ISSN 1927-1271 print, 1927-128X online, Open Access |
| Article copyright, the authors; Journal compilation copyright, J Clin Gynecol Obstet and Elmer Press Inc |
| Journal website https://www.jcgo.org |
Original Article
Volume 11, Number 2, June 2022, pages 33-38
Risk Factors for Intrapartum Fever of Infectious Origin and Maternal and Neonatal Morbidity
Figures
Tables
| Intrapartum fever (n = 203), mean/n (± SD/%) | |
|---|---|
| GBS: group B streptococcus; NICU: neonatal intensive care unit; PROM: premature rupture of membranes; SD: standard deviation. | |
| Maternal age (years) | 32.76 (± 4.9) |
| Gestational age (weeks) | 40 + 1 (± 1.2) |
| Nulliparity | 167 (82.3) |
| Previous cesarean section | 34 (15.9) |
| Induction of labor | 116 (57.1) |
| Internal catheter | 48 (23.6) |
| Time from PROM to delivery (minutes) | 1,096.7 (± 740.2) |
| Time from PROM to fever (minutes) | 877.5 (± 704.1) |
| Time from fever to delivery (minutes) | 211.4 (± 226.9) |
| Vaginal examination | 7.3 (± 4) |
| Normal delivery | 79 (38.9) |
| Instrumental delivery | 68 (33.5) |
| Cesarean section | 56 (27.6) |
| Epidural analgesia | 202 (99.5) |
| Positive GBS | 34 (16.7) |
| Positive urine culture | 6 (3) |
| Positive blood culture | 15 (7.4) |
| Positive placental culture | 76 (37.4) |
| Pathological placenta in histologic study | 127 (62.6) |
| NICU admission | 6 (3) |
| Apgar first minute | 8 (± 1.2) |
| Apgar fifth minute | 10 (± 0.8) |
| Umbilical artery cord pH | 7.2 (± 0.1) |
| Neonatal positive culture | 3 (2.7) |
| Infectious intrapartum fever (n = 150), n (%) | P value | OR (95% CI) | |
|---|---|---|---|
| OR: odds ratio; CI: confidence interval; GBS: group B streptococcus. | |||
| Age > 32 years | 53 (35.3) | 0.008 | 3.07 (1.35 - 7) |
| Gestational age > 40 weeks | 42 (28.0) | 0.574 | 0.82 (0.42 - 1.62) |
| Nulliparity | 122 (81.3) | 0.558 | 1.29 (0.55 - 3.04) |
| Previous cesarean section | 26 (17.3) | 0.707 | 1.18 (0.5 - 2.8) |
| Induction of labor | 84 (59.6) | 0.233 | 1.47 (0.78 - 2.79) |
| Epidural analgesia | 149 (99.3) | 0.551 | |
| Internal catheter | 35 (23.3) | 0.860 | 1.42 (0.74 - 2.72) |
| Positive GBS | 25 (16.9) | 0.902 | 0.95 (0.41 - 2.19) |
| Fetal tachycardia | 72 (48) | 0.895 | 0.96 (0.51 - 1.79) |
| Vaginal examination > 7 | 59 (39.9) | 0.245 | 0.69 (0.37 - 1.29) |
| Fever to delivery duration > 6 h | 27 (18.1) | 0.011 | 6.11 (1.35 - 27.62) |
| Infectious intrapartum fever (n = 150), n (%) | P value | OR (95% CI) | |
|---|---|---|---|
| OR: odds ratio; CI: confidence interval; NICU: neonatal intensive care unit. | |||
| Normal delivery | 60 (40) | 0.594 | 0.84 (0.44 - 1.61) |
| Cesarean delivery | 40 (26.7) | 0.622 | 0.84 (0.42 - 1.68) |
| pH < 7 | 1 (0.7) | 0.567 | |
| Apgar first minute < 4 | 3 (2) | 0.955 | 1.07 (0.11 - 10.5) |
| Apgar fifth minute < 7 | 4 (2.7) | 0.748 | 1.43 (0.16 - 13.13) |
| Fetal fever | 7 (4.7) | 0.805 | 1.22 (0.25 - 6.08) |
| NICU admission | 5 (3.4) | 0.610 | 1.75 (0.2 - 15.33) |