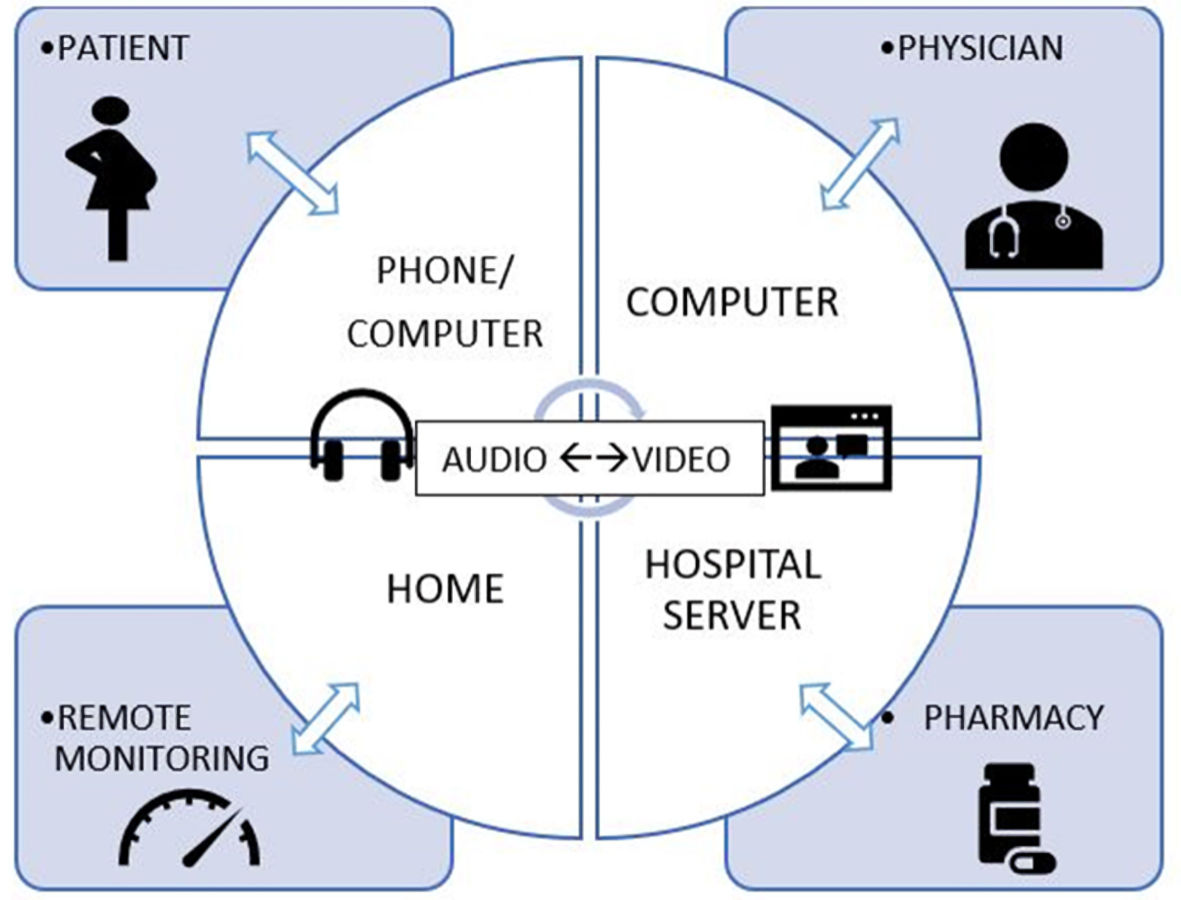
Figure 1. Cloud-based telemedicine services.
| Journal of Clinical Gynecology and Obstetrics, ISSN 1927-1271 print, 1927-128X online, Open Access |
| Article copyright, the authors; Journal compilation copyright, J Clin Gynecol Obstet and Elmer Press Inc |
| Journal website https://www.jcgo.org |
Original Article
Volume 11, Number 3, September 2022, pages 62-68
Virtual Prenatal Care During a Pandemic: How Satisfying Is It to the Caregivers and the Patients?
Figure
Tables
| Demographics | N (%) |
|---|---|
| Ethnicity | |
| Black | 5 (9.4) |
| Caucasian | 26 (49.1) |
| East Asian | 9 (17) |
| South Asian | 6 (11.3) |
| Hispanic/Latino | 2 (3.8) |
| Mediterranean | 2 (3.8) |
| Others | 4 |
| First pregnancy with prenatal care provider | 36 (67.9) |
| Work from home/stay at home | 22 |
| Working outside/essential job | 27 (50.9) |
| Partnered/married | 50 (94.3) |
| Previous loss | |
| Miscarriage/early pregnancy loss | 15 (28.3) |
| Stillbirth | 2 (3.8) |
| Mean age | 32.7 |
| Travel distance > 20 km | 9 (16.9) |
| Domain question | Mean scores | Mean estimated difference | 95% confidence interval | P value | |
|---|---|---|---|---|---|
| Traditional visit | Virtual visit | ||||
| *P < 0.05. | |||||
| Scheduling | |||||
| Ease of scheduling your visits | 4.60 | 4.38 | 0.212 | 0.034 - 0.389 | 0.020* |
| Frequency with which visits started on time | 4.02 | 3.88 | 0.135 | -0.393 - 0.393 | 0.301 |
| Convenience of visit times and dates | 4.19 | 4.37 | 0.173 | -0.362 - 0.016 | 0.071 |
| Provider | |||||
| How well the provider explained her role in your care | 4.66 | 4.62 | 0.040 | -0.132 - 0.212 | 0.642 |
| Friendliness/courtesy of provider | 4.88 | 4.76 | 0.118 | 0.026 - 0.209 | 0.013* |
| Explanations about procedures occurring during your visits | 4.52 | — | |||
| Explanations about how to use the doppler and blood pressure cuff | — | 3.91 | |||
| Degree to which the provider took time to listen to you | 4.69 | 4.57 | 0.118 | -0.038 - 0.273 | 0.135 |
| Provider’s concern for your questions and worries | 4.65 | 4.63 | 0.20 | -0.134 - 0.174 | 0.799 |
| Personal | |||||
| Concern for your privacy | 4.67 | 4.73 | -0.58 | -0.174 - 0.158 | 0.322 |
| Sensitivity to your needs | 4.62 | 4.63 | -0.19 | -0.160 - 0.121 | 0.785 |
| Response to concerns made during visits | 4.67 | 4.60 | 0.77 | -0.078 - 0.231 | 0.322 |
| Ease of accessing virtual visit provider/obstetrician | 4.17 | 4.21 | -0.42 | -0.240 - 0.157 | 0.674 |
| Technology | |||||
| Ease of connecting to virtual visits | — | 4.68 | |||
| Quality of connection during virtual visits | — | 4.64 | |||
| Ease of using blood pressure monitor | — | 4.26 | |||
| General | |||||
| Overall rating of care received traditional/virtual prenatal care | 4.73 | 4.47 | 0.255 | 0.061 - 0.448 | 0.011* |
| Satisfaction with traditional/virtual visits | 4.67 | 4.24 | 0.431 | 0.198 - 0.665 | 0.001* |
| Likelihood of recommending traditional/virtual visits | 4.64 | 3.92 | 0.720 | 0.375 - 1.065 | 0.000* |
| Likelihood of continuing care at St. Michael’s Hospital | 4.69 | 4.53 | 0.157 | 0.015 - 0.299 | 0.001* |
| Domain score | Traditional visits | Virtual visits | Mean estimated difference | 95% confidence interval | P value |
|---|---|---|---|---|---|
| *P < 0.05. | |||||
| Scheduling | 4.26 | 4.21 | 0.057 | -0.08 - 1.97 | 0.41 |
| Provider | 4.72 | 4.64 | 0.075 | -0.03 - 0.18 | 0.175 |
| Personal | 4.52 | 4.52 | -0.01 | -0.12 - 1.05 | 0.85 |
| Overall satisfaction | 4.66 | 4.31 | 0.357 | 0.17 - 0.53 | 0.00* |
| Total mean satisfaction scores | |||||
| Without technology domain | 4.56 | 4.43 | 0.129 | 0.018 - 0.239 | 0.023 |
| With technology domain | 4.56 | 4.45 | 0.105 | -0.004 - 0.216 | 0.060* |
| Domain questions | Physicians (n = 15) responses | Mean scores (maximum 20) |
|---|---|---|
| PEOU: perceived ease of use; PU: perceived usefulness; BI: behavioural intention; ATU: actual telemedicine utilization; SE: user satisfaction. | ||
| PEOU | 14 | 13.0 (5 - 20) |
| PU | 14 | 12.7 (10 - 15) |
| ATU | 14 | 13.2 (5 - 20) |
| BI | 14 | 12.8 (5 - 19) |
| SE | 14 | 13.6 (9 - 20) |
| Total | 14 | 65.5 (34 - 89) |
| Demographic of physicians | Comparison | Mean difference in scores | P value |
|---|---|---|---|
| Age | < 50 vs. ≥ 50 | 10.8 | 0.12 |
| Telemedicine use | Seldom and rare use vs. often and very often use | -11.2 | 0.117 |
| Prior telehealth experience | Physicians with prior tele health experience vs. no prior telehealth experience | 5.7 | 0.40 |
| Gender | Male vs. female | 7.3 | 0.43 |
| PEOU | PU | ATU | BI | SE | |
|---|---|---|---|---|---|
| PEOU: perceived ease of use; PU: perceived usefulness; BI: behavioural intention; ATU: actual telemedicine utilization; SE: user satisfaction. | |||||
| PEOU | r = 0.26 P = 0.43 | r = 0.34, P = 0.30 | r = 0.52, P = 0.09 | r = 0.48, P = 0.13 | |
| PU | r = -0.22, P = 0.52 | r = -0.5, P = 0.117 | r = 0.33, P = 0.31 | ||
| ATU | r = 0.33, P = 0.31 | r = 0.28, P = 0.39 | |||
| BI | r = -0.17, P = 0.61 | ||||
| SE | |||||