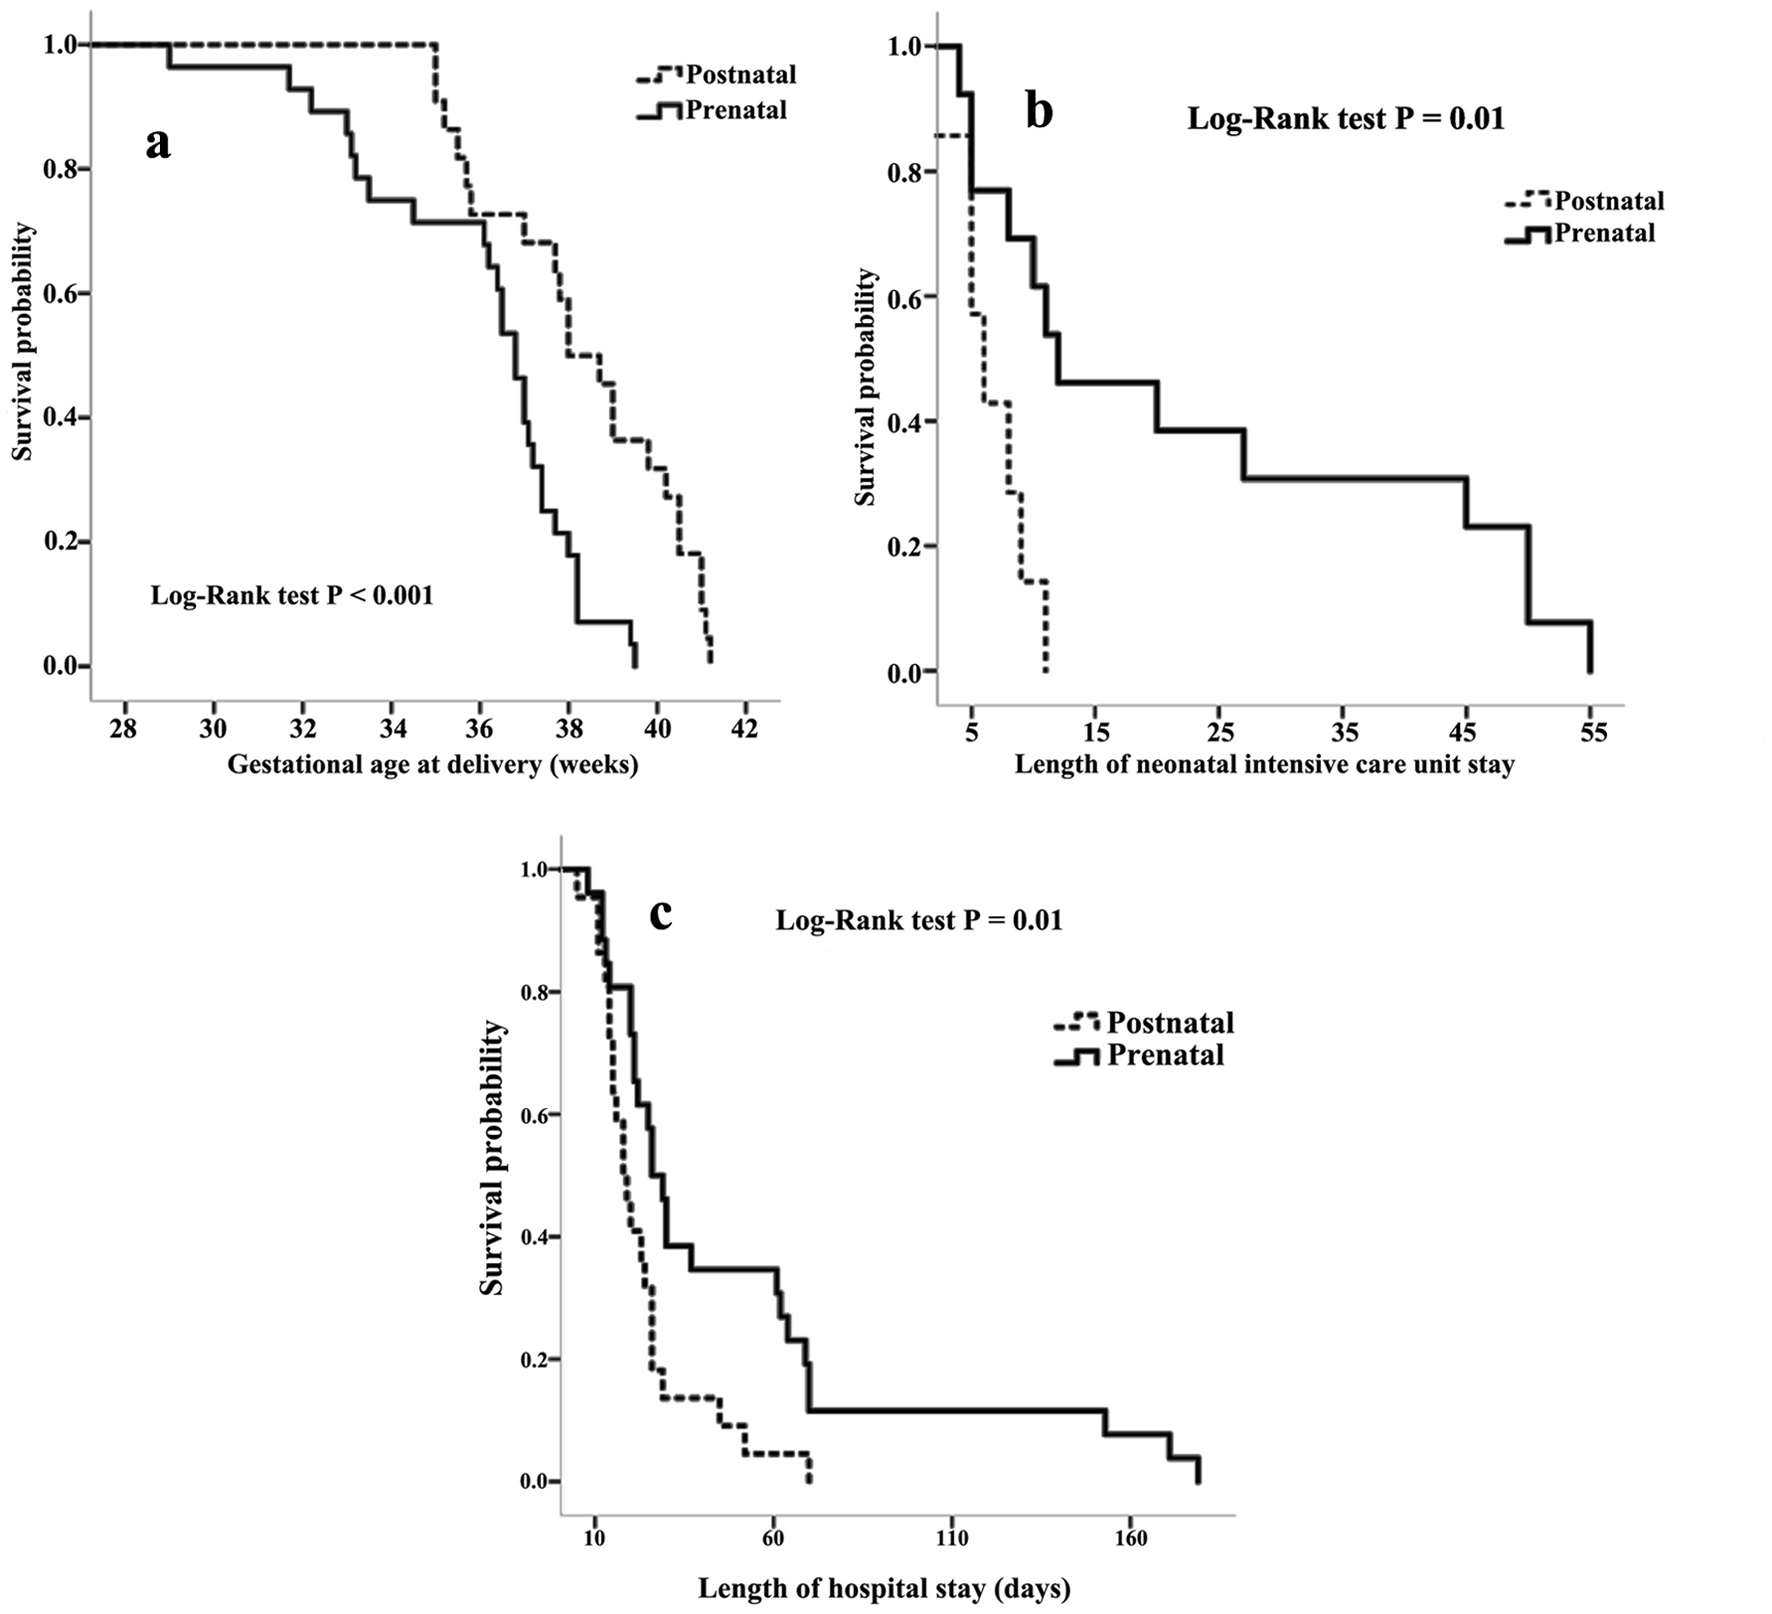
Figure 1. Kaplan-Meier survival curves demonstrating the gestational age of delivery (a), the duration of hospital stay (b) and the duration of neonatal intensive care unit stay (c) data in the postnatal group and prenatal group.
| Journal of Clinical Gynecology and Obstetrics, ISSN 1927-1271 print, 1927-128X online, Open Access |
| Article copyright, the authors; Journal compilation copyright, J Clin Gynecol Obstet and Elmer Press Inc |
| Journal website https://www.jcgo.org |
Original Article
Volume 12, Number 1, March 2023, pages 1-7
What Are the Top Benefits of a Prenatal Diagnosis of Fetal Esophageal or Intestinal Atresia?
Figure
Tables
| Maternal characteristics | Prenatal (n = 29) | Postnatal (n = 22) | P |
|---|---|---|---|
| aAverage distance between where the patient lives and the tertiary center used for a prenatal care. *P < 0.05. Data are given as mean ± standard deviation, median (interquartile range) or n (%). Comparisons between groups by Chi-square or Fisher’s exact tests for categorical variables and the Mann-Whitney U-test and unpaired t-tests for continuous variables. BMI: body mass index; NA: not applicable. | |||
| Age (years) | 31 ± 5 | 29 ± 6 | 0.01* |
| BMI (kg/m2) | 24 ± 5 | 24 ± 3 | 0.21 |
| Obese (BMI ≥ 30 kg/m2) | 4 (14%) | 1 (5%) | 0.65 |
| Smoking during pregnancy | |||
| Non-smoker | 15 (52%) | 15 (68%) | 0.16 |
| Smoker < 10 cigarettes/day | 5 (17%) | 2 (9%) | |
| Smoker ≥ 10 cigarettes/day | 2 (6%) | 1 (5%) | |
| Obstetric history | |||
| Nulliparous | 13 (45%) | 12 (54%) | 0.57 |
| Presence of uterine scar | 5 (17%) | 1 (5%) | 0.40 |
| Diabetes | |||
| Pre-gestational diabetes mellitus | 0 (0%) | 1 (5%) | 0.29 |
| Gestational diabetes mellitus | 3 (10%) | 4 (18%) | |
| Abnormal level II ultrasound | 29 (100%) | 3 (14%) | < 0.01* |
| Gestational age at time of level III ultrasound | 24 (10) | NA | - |
| Distance between the patient’s residence and the tertiary centre (km)a | 83 (78) | 86 (70) | 0.90 |
| Number of visits in a tertiary center | 4 (3.5) | 1.8 (1) | 0.01* |
| Overall consultations in a tertiary center | 6 (5) | 0 (0) | 0.01* |
| Total travel length (km) | 661 (815) | 164 (180) | 0.01* |
| Obstetric outcomes | Prenatal (n = 29) | Postnatal (n = 22) | P |
|---|---|---|---|
| *P < 0.05. Data are given as mean ± standard deviation, median (interquartile range) or n (%). Comparisons between groups by Chi-square or Fisher’s exact tests for categorical variables and the Mann-Whitney U-test and unpaired t-tests for continuous variables. GA: gestational age; NA: not applicable. | |||
| Polyhydramnios | 12 (41%) | 5/11 (45%) | > 0.99 |
| Hospitalization in high-risk maternity unit | 7 (24%) | 2 (9%) | 0.27 |
| Severe polyhydramnios | 4 (14%) | 0 (0%) | 0.12 |
| At high-risk of preterm birth | 3 (10%) | 1 (5%) | 0.65 |
| Premature rupture of membranes | 3 (10%) | 0 (0%) | 0.26 |
| Course of antenatal steroids | 9 (31%) | NA | - |
| GA at delivery (weeks) | 36 ± 2.5 | 38 ± 2.2 | 0.10 |
| Delivery before 37 weeks | 17 (59%) | 7 (31%) | 0.05* |
| Delivery before 34 weeks | 7 (24%) | 0 (0%) | 0.01* |
| Induction of labor | 12 (41%) | 9 (41%) | 0.77 |
| Mode of delivery, indication | |||
| Vaginal | 14 (48%) | 10 (45%) | 0.58 |
| Operative vaginal | 4 (14%) | 5 (23%) | 0.54 |
| Elective cesarian delivery | 7 (24%) | 3 (14%) | 0.77 |
| Cesarian delivery for fetal indication | 4 (14%) | 4 (18%) | |
| Variable | Crude OR (95% CI) | P value |
|---|---|---|
| *P < 0.05. BMI: body mass index; OR: odds ratio; CI: confidence interval. | ||
| Maternal characteristics | ||
| Maternal age (years) | 1.04 (0.94 - 1.15) | 0.49 |
| Maternal BMI (kg/m2) | 0.91 (0.80 - 1.05) | 0.20 |
| Smoking during pregnancy | ||
| Non-smoker (reference) | 1.00 | 0.30 |
| Smoker | 0.55 (0.18 - 1.70) | |
| Parous (reference) | 1.00 | 0.66 |
| Nulliparous | 1.28 (0.42 - 3.93) | |
| Pregnancy complication | ||
| Gestational diabetes | 1.55 (0.42 - 5.77) | 0.51 |
| Polyhydramnios | 1.53 (0.42 - 5.61) | 0.52 |
| Severe polyhydramnios | 4.06 (0.39 - 42.49) | 0.24 |
| Type of atresia | ||
| Esophageal atresia | 1.36 (0.45 - 4.16) | 0.56 |
| Duodenal atresia | 1.53 (0.31 - 7.69) | 0.60 |
| Jejunoileal atresia | 0.78 (0.24 - 2.57) | 0.68 |
| Colonic atresia | 0.33 (0.03 - 3.45) | 0.36 |
| Associated anomalies | 1.15 (0.38 - 3.53) | 0.80 |
| Prenatal diagnosis | 3.12 (1.02 - 10.72) | 0.046* |
| Total travel length (km) | 1.00 (0.99 - 1.00) | 0.58 |
| Neonatal outcomes | Prenatal (n = 30) | Postnatal (n = 22) | P |
|---|---|---|---|
| aMissing information *P < 0.05. Data are given as mean ± standard deviation, median (interquartile range) or n (%). Comparisons between groups by Chi-square or Fisher’s exact tests for categorical variables and the Mann-Whitney U-test and unpaired t-tests for continuous variables. | |||
| Sex | |||
| Male | 18 | 13 | > 0.99 |
| Female | 12 | 9 | |
| Birth weight (g) | 2,633 ± 684 | 2,800 ± 486 | 0.35 |
| Birth height (cm) | 47.6 ± 2 | 46.8 ± 1.5 | 0.21 |
| Head circumference at birth (cm) | 35 ± 1.5 | 34 ± 0.8 | 0.04* |
| 5-min Apgar score < 7 | 2 (7%) | 0 (0%) | 0.52 |
| pH < 7.20 | 8 (27%) | 2/10 (20%)a | > 0.71 |
| Mechanical ventilation | 15 (52%) | 10 (45%) | > 0.99 |
| Phototherapy | 5 (17%) | 3 (14%) | > 0.99 |
| Infection | 19 (65%) | 8 (36%) | 0.09 |
| Associated anomalies | 13 (45%) | 10 (45%) | > 0.99 |
| VACTERL | 2 (7%) | 1 (5%) | |
| CHARGE syndrome | 1 (3%) | 0 (0%) | |
| Chromosomal anomalies | 3 (10%) | 0 (0%) | |
| Type of atresia | |||
| Esophageal atresia | 9 (31%) | 15 (68%) | 0.06* |
| Duodenal atresia | 5 (17%) | 2 (14%) | 0.67 |
| Jejunoileal atresia | 14 (46%) | 3 (14%) | 0.02* |
| Colonic atresia | 2 (7%) | 2 (9%) | > 0.99 |
| Age at surgery (days) | 2 (2) | 2 (2.5) | 0.80 |
| Cutaneous stoma | 10 (34%) | 4 (18%) | 0.34 |
| Second surgery | 10 (34%) | 5 (23%) | 0.54 |
| Parenteral nutrition (days) | 7 (7) | 7 (7) | 0.64 |
| Duration of hospital stay (days) | 28 (45) | 18 (12) | 0.08 |
| Duration of neonatal intensive care unit stay (days) | 12 (41) | 6 (4) | 0.02* |
| Duration of neonatal reanimation stay (days) | 10 (15) | 10 (6) | 0.86 |
| Neonatal death | 2 (7%) | 1 (5%) | > 0.99 |