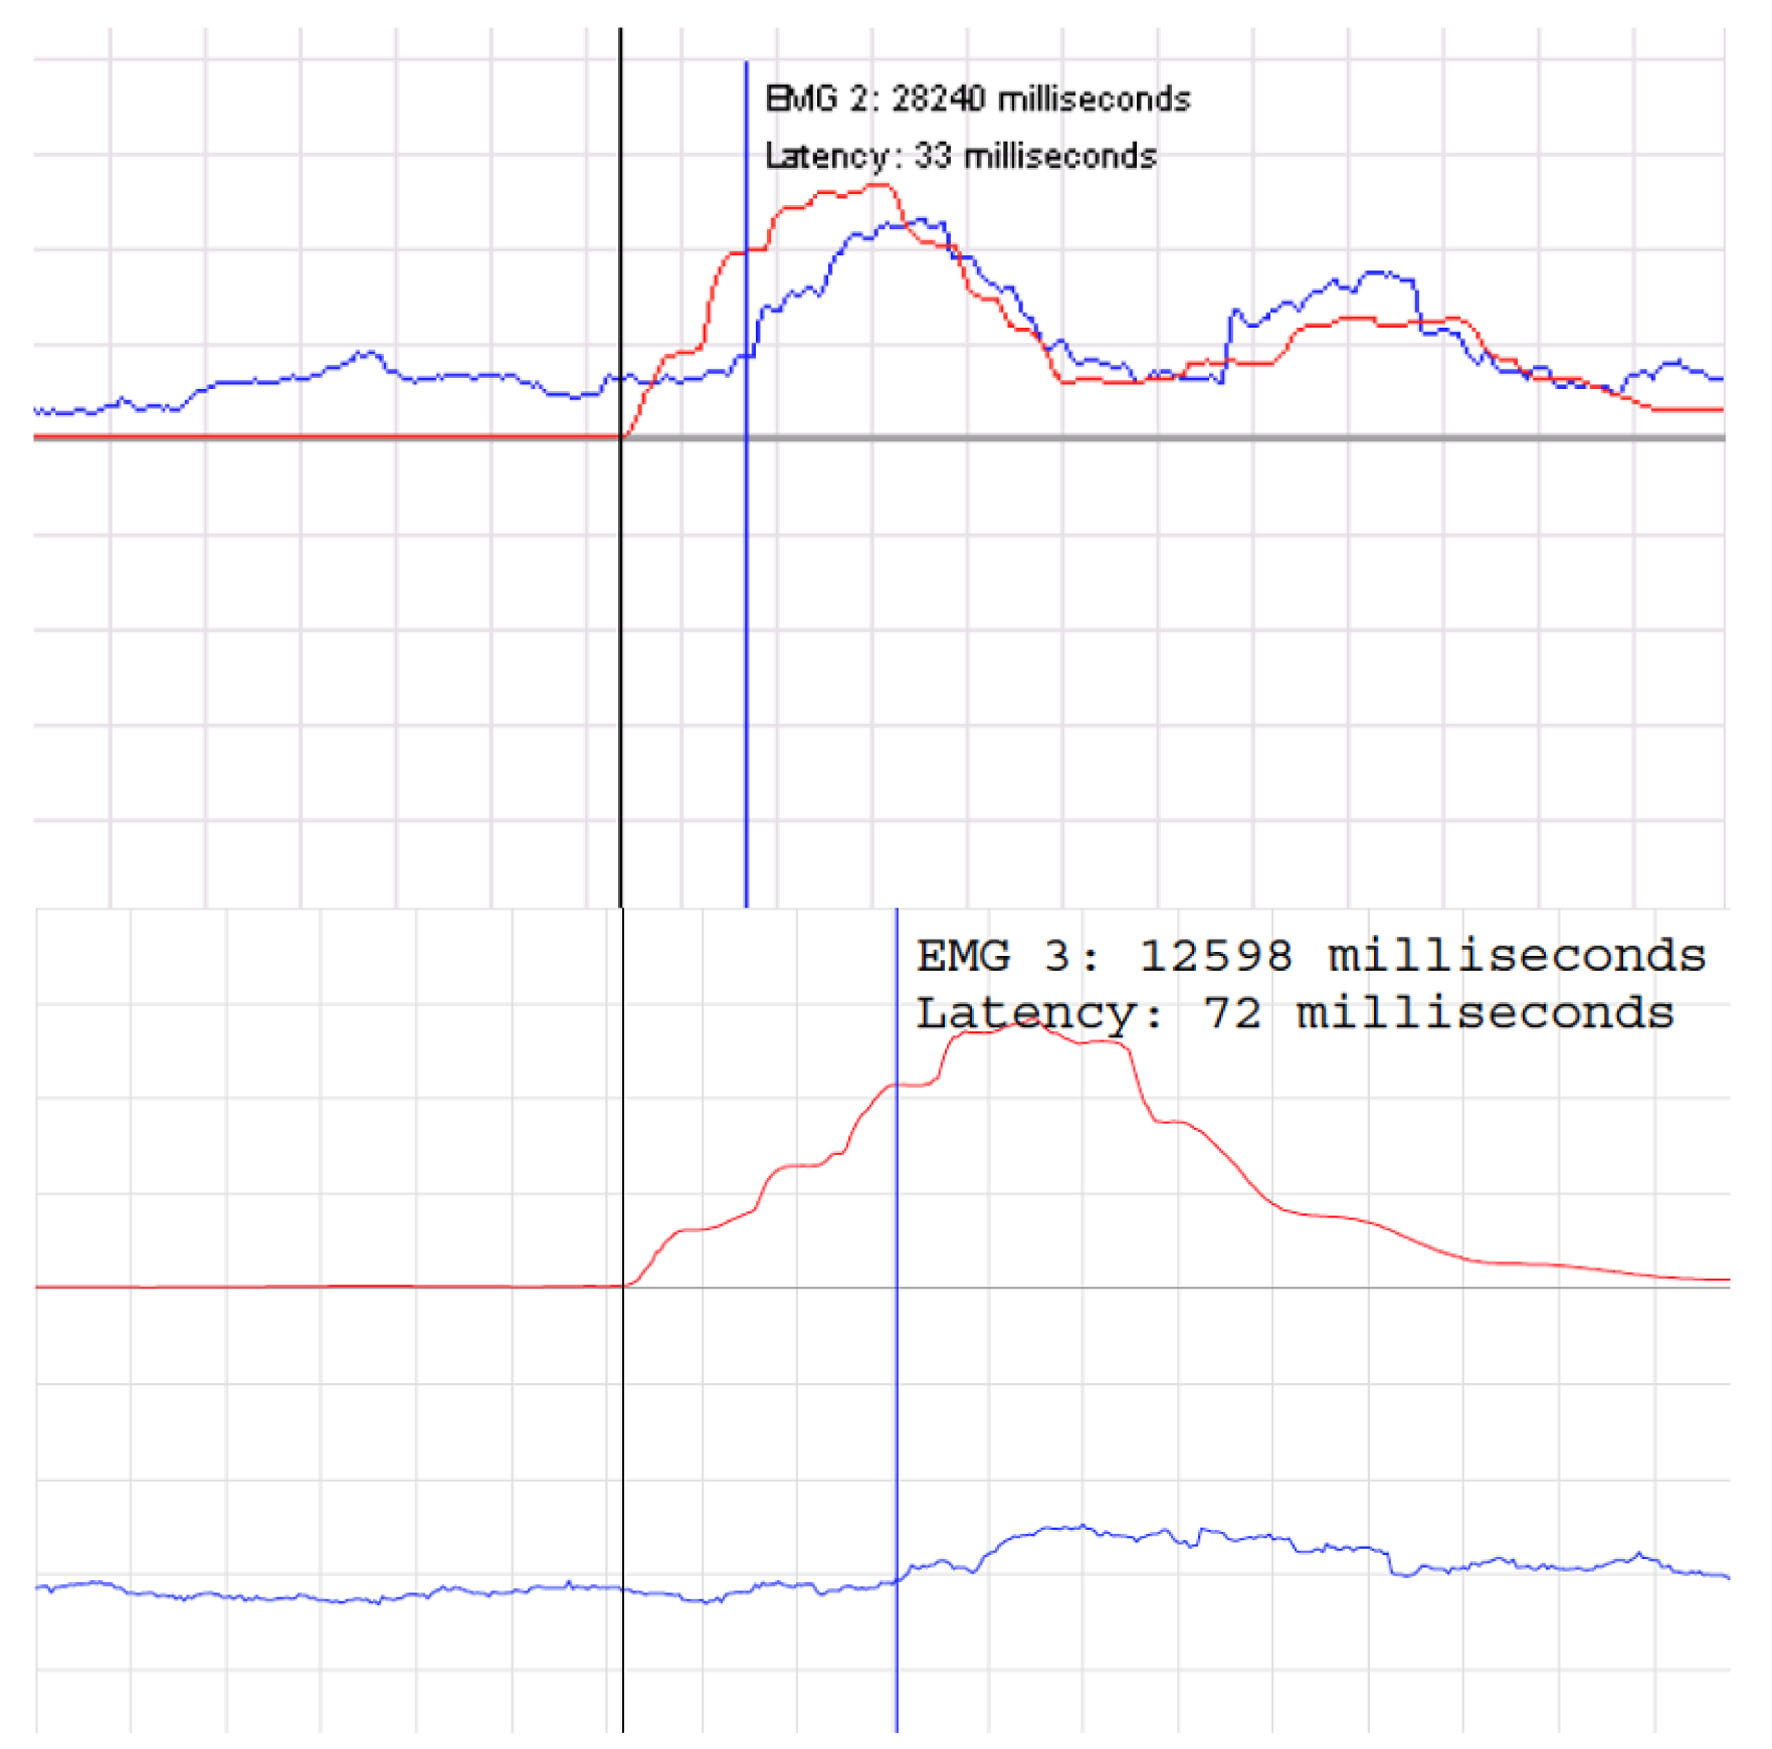
Figure 1. Normal bulbocavernosus reflex latency test above with latency 33 ms. Abnormal bulbocavernosus reflex latency test below with latency 72 ms.
| Journal of Clinical Gynecology and Obstetrics, ISSN 1927-1271 print, 1927-128X online, Open Access |
| Article copyright, the authors; Journal compilation copyright, J Clin Gynecol Obstet and Elmer Press Inc |
| Journal website https://www.jcgo.org |
Original Article
Volume 12, Number 2, August 2023, pages 33-38
Bulbocavernosus Reflex as an Objective Measure of Improvement Following Directed Pelvic Floor Rehabilitation for Treatment of Urinary Incontinence
Figure
Tables
| Characteristics | N | Min | Median | Max | Mean | SD |
|---|---|---|---|---|---|---|
| SD: standard deviation; UI: urinary incontinence. | ||||||
| Continuous measures | ||||||
| Age | 93 | 18 | 53 | 96 | 50.9 | 17.07 |
| Symptom duration | 78 | 0.1 | 3.6 | 21 | 3.6 | 4.25 |
| Daytime voiding frequency | 78 | 1.5 | 6 | 17 | 7.3 | 3.50 |
| Nighttime voiding frequency | 78 | 0 | 2.5 | 7.5 | 2.2 | 1.47 |
| Caffeine daily intake (mL) | 70 | 0 | 355 | 1,538 | 369.7 | 312.30 |
| Fluid daily intake (mL) | 83 | 355 | 1,301 | 3,785 | 1,537.8 | 833.09 |
| Number of accidents per day | 86 | 0 | 1 | 8 | 1.5 | 1.81 |
| Number of vaginal deliveries | 90 | 0 | 2 | 5 | 1.6 | 1.28 |
| Number of C-sections | 90 | 0 | 0 | 3 | 0.3 | 0.61 |
| Number of episiotomies | 90 | 0 | 0 | 5 | 0.5 | 0.78 |
| Categorical measures | Category | N | % | |||
| Type of pad | Diapers | 7 | 7.4 | |||
| Face towels | 1 | 1.1 | ||||
| None | 1 | 1.1 | ||||
| Pads | 4 | 4.2 | ||||
| Panty liners | 8 | 8.4 | ||||
| Regular pads | 3 | 3.2 | ||||
| Underwear | 5 | 5.3 | ||||
| Alcohol consumption | No | 52 | 54.7 | |||
| Yes/occasionally | 39 | 41.1 | ||||
| Not reported | 4 | 4.2 | ||||
| Bowel habits | Constipation | 3 | 3.2 | |||
| Diarrhea | 1 | 1.1 | ||||
| Fecal incontinence | 1 | 1.1 | ||||
| Regular | 15 | 15.8 | ||||
| Not reported | 75 | 78.9 | ||||
| Pregnant/trying to conceive | No | 89 | 93.7 | |||
| Yes | 2 | 2.1 | ||||
| Not reported | 4 | 4.2 | ||||
| Diagnoses (can be multiple) | Chronic pelvic pain | 7 | 7.4 | |||
| Constipation | 1 | 1.1 | ||||
| Cystocele | 1 | 1.1 | ||||
| Dyspareunia | 1 | 1.1 | ||||
| Frequency of urination | 37 | 38.9 | ||||
| Incomplete bladder emptying | 2 | 2.1 | ||||
| Mixed UI | 2 | 2.1 | ||||
| Muscle spasm | 1 | 1.1 | ||||
| Pelvic pain | 10 | 10.5 | ||||
| Prolapse | 5 | 5.3 | ||||
| Rectocele | 1 | 1.1 | ||||
| Sexual dysfunction | 3 | 3.2 | ||||
| Stress UI | 61 | 64.2 | ||||
| Urge UI | 28 | 29.5 | ||||
| Urgency of urination | 1 | 1.1 | ||||
| Not reported | 11 | 11.6 | ||||
| Variable | N | Min | Median | Max | Mean | SD | ta | P | Mean differenceb | 95% bootstrap CI of differencec |
|---|---|---|---|---|---|---|---|---|---|---|
| aBased on paired t-test. Note that these results were the same statistically as the results of the nonparametric tests. bBased on (time 2 - time 1); a positive difference denotes an increase in score, and a negative difference denotes a decrease in score. cBased on 10,000 bootstrap resamples of the data. Note that intervals not containing “0” are significant. BRS: Bulbocavernosus Reflex System; CI: confidence interval; PT: post-treatment; SD: standard deviation. | ||||||||||
| BRS baseline | 95 | 37 | 82 | 273 | 85.0 | 26.86 | -16.27 | < 0.001 | -49.6 | -58.33, -45.95 |
| BRS PT | 95 | 7 | 34 | 77 | 35.4 | 13.65 | ||||
| Manometry baseline | 95 | 0.8 | 36 | 115.9 | 40.2 | 28.75 | 5.27 | < 0.001 | 16.2 | 7.56, 25.58 |
| Manometry PT | 95 | 1.8 | 51.9 | 168.4 | 56.4 | 33.91 | ||||
| Number of pads Baseline | 85 | 0 | 0 | 8 | 1.0 | 1.57 | -6.12 | < 0.001 | -1.0 | -1.34, -0.71 |
| Number of pads PT | 90 | 0 | 0 | 2 | 0.1 | 0.28 | ||||
| Number of leaks Baseline | 86 | 0 | 1 | 9 | 1.8 | 2.17 | -7.64 | < 0.001 | -1.8 | -2.09, -1.24 |
| Number of leaks PT | 89 | 0 | 0 | 1 | 0.01 | 0.11 | ||||
| Number of treatments | 95 | 4 | 8 | 16 | 8.8 | 2.48 | ||||
| Perceived improvement | 95 | 20% | 80% | 100% | 80% | 17.79% | ||||
| Level of satisfaction | 26 | 50% | 100% | 100% | 92.7% | 12.5% | ||||