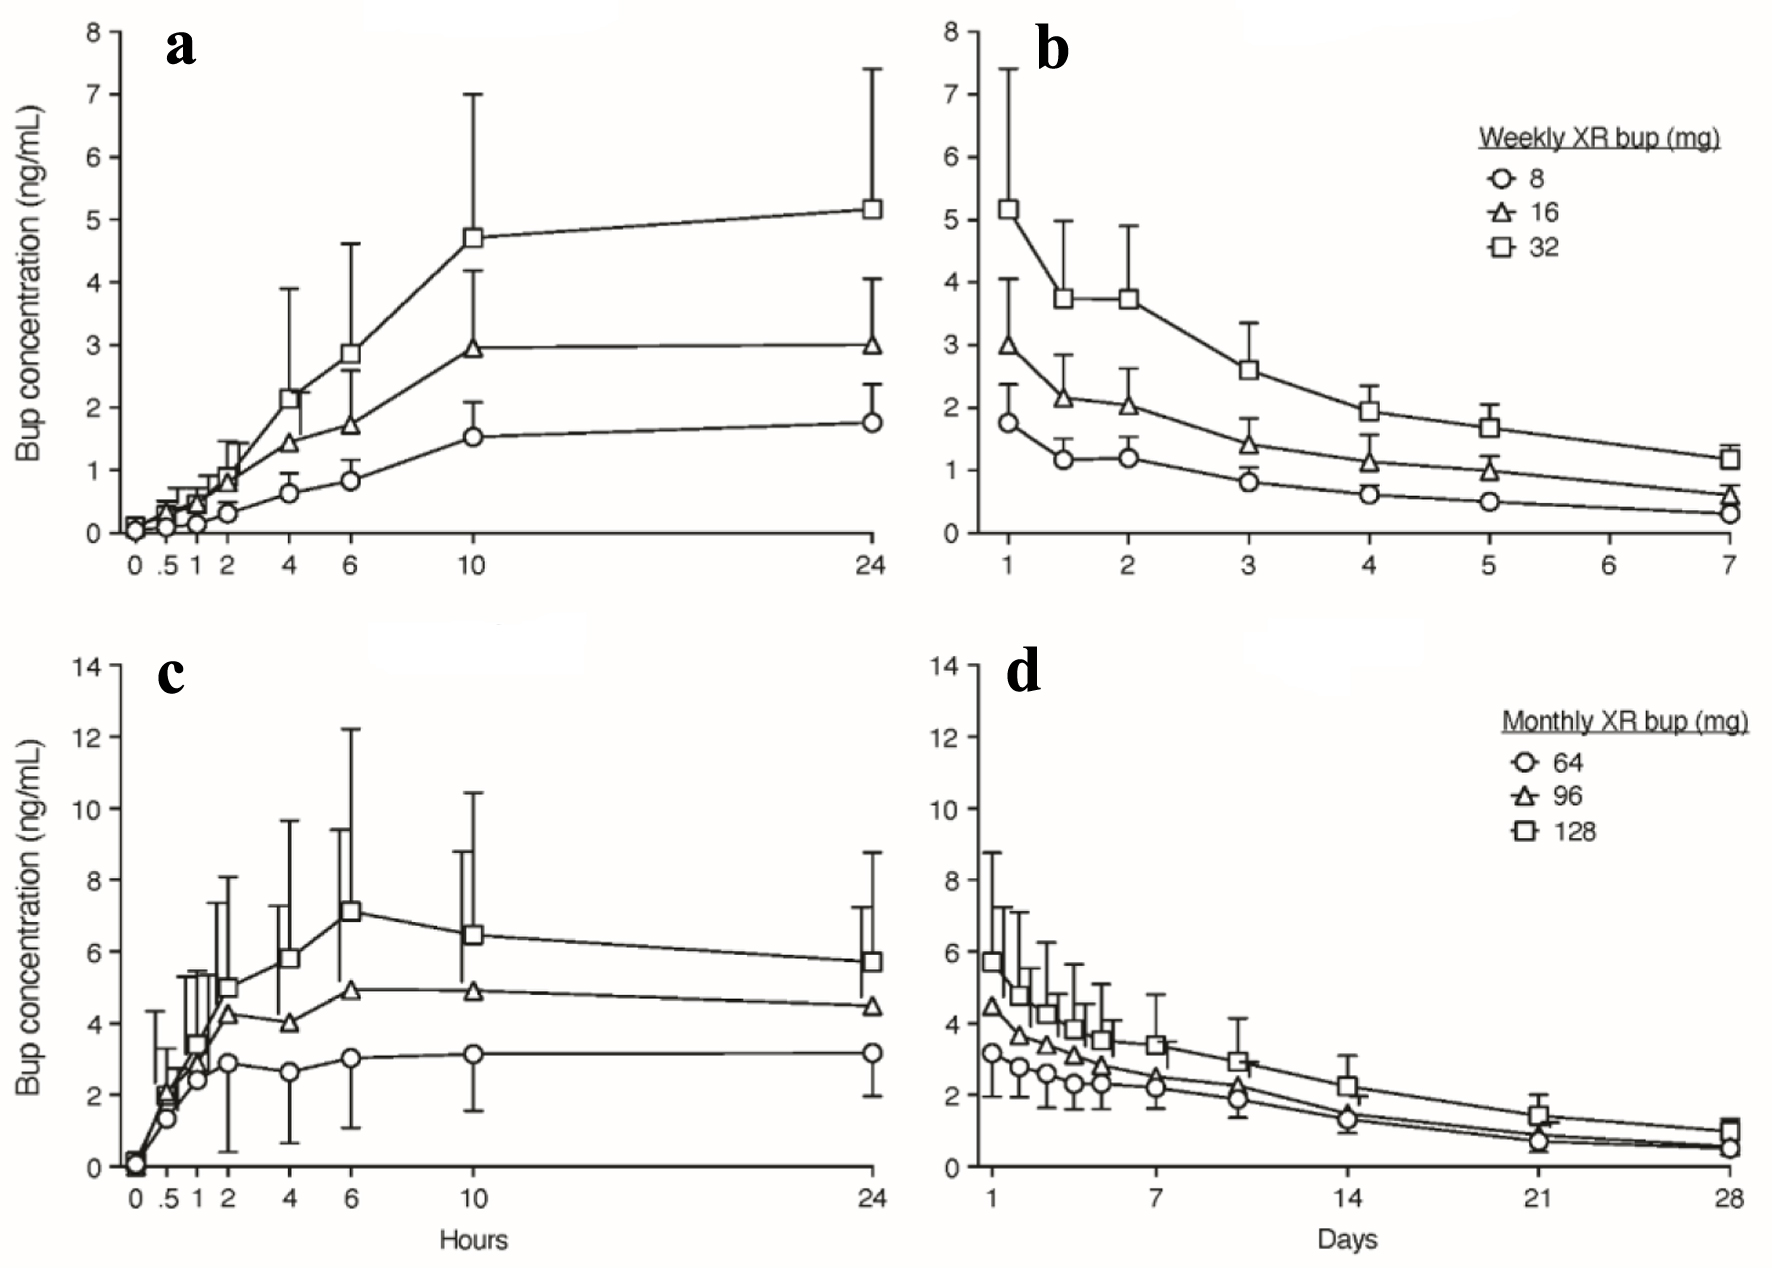
Figure 1. Buprenorphine concentrations over time after weekly and monthly XR-buprenorphine administration. Data displayed are means with standard deviations (SDs) in one direction and staggered to the side of the mean value when needed to preserve figure clarity. (a, b) Buprenorphine (Bup) concentrations (ng/mL) over the first 24 h and 7 days, respectively, after administration of weekly XR-bup. (c, d) Bup concentrations over the first 24 h and 28 days, respectively, after administration of monthly XR-bup. CAM2038 Investigators Brochure. Braeburn Inc. Edition 17. April 5, 2023.
