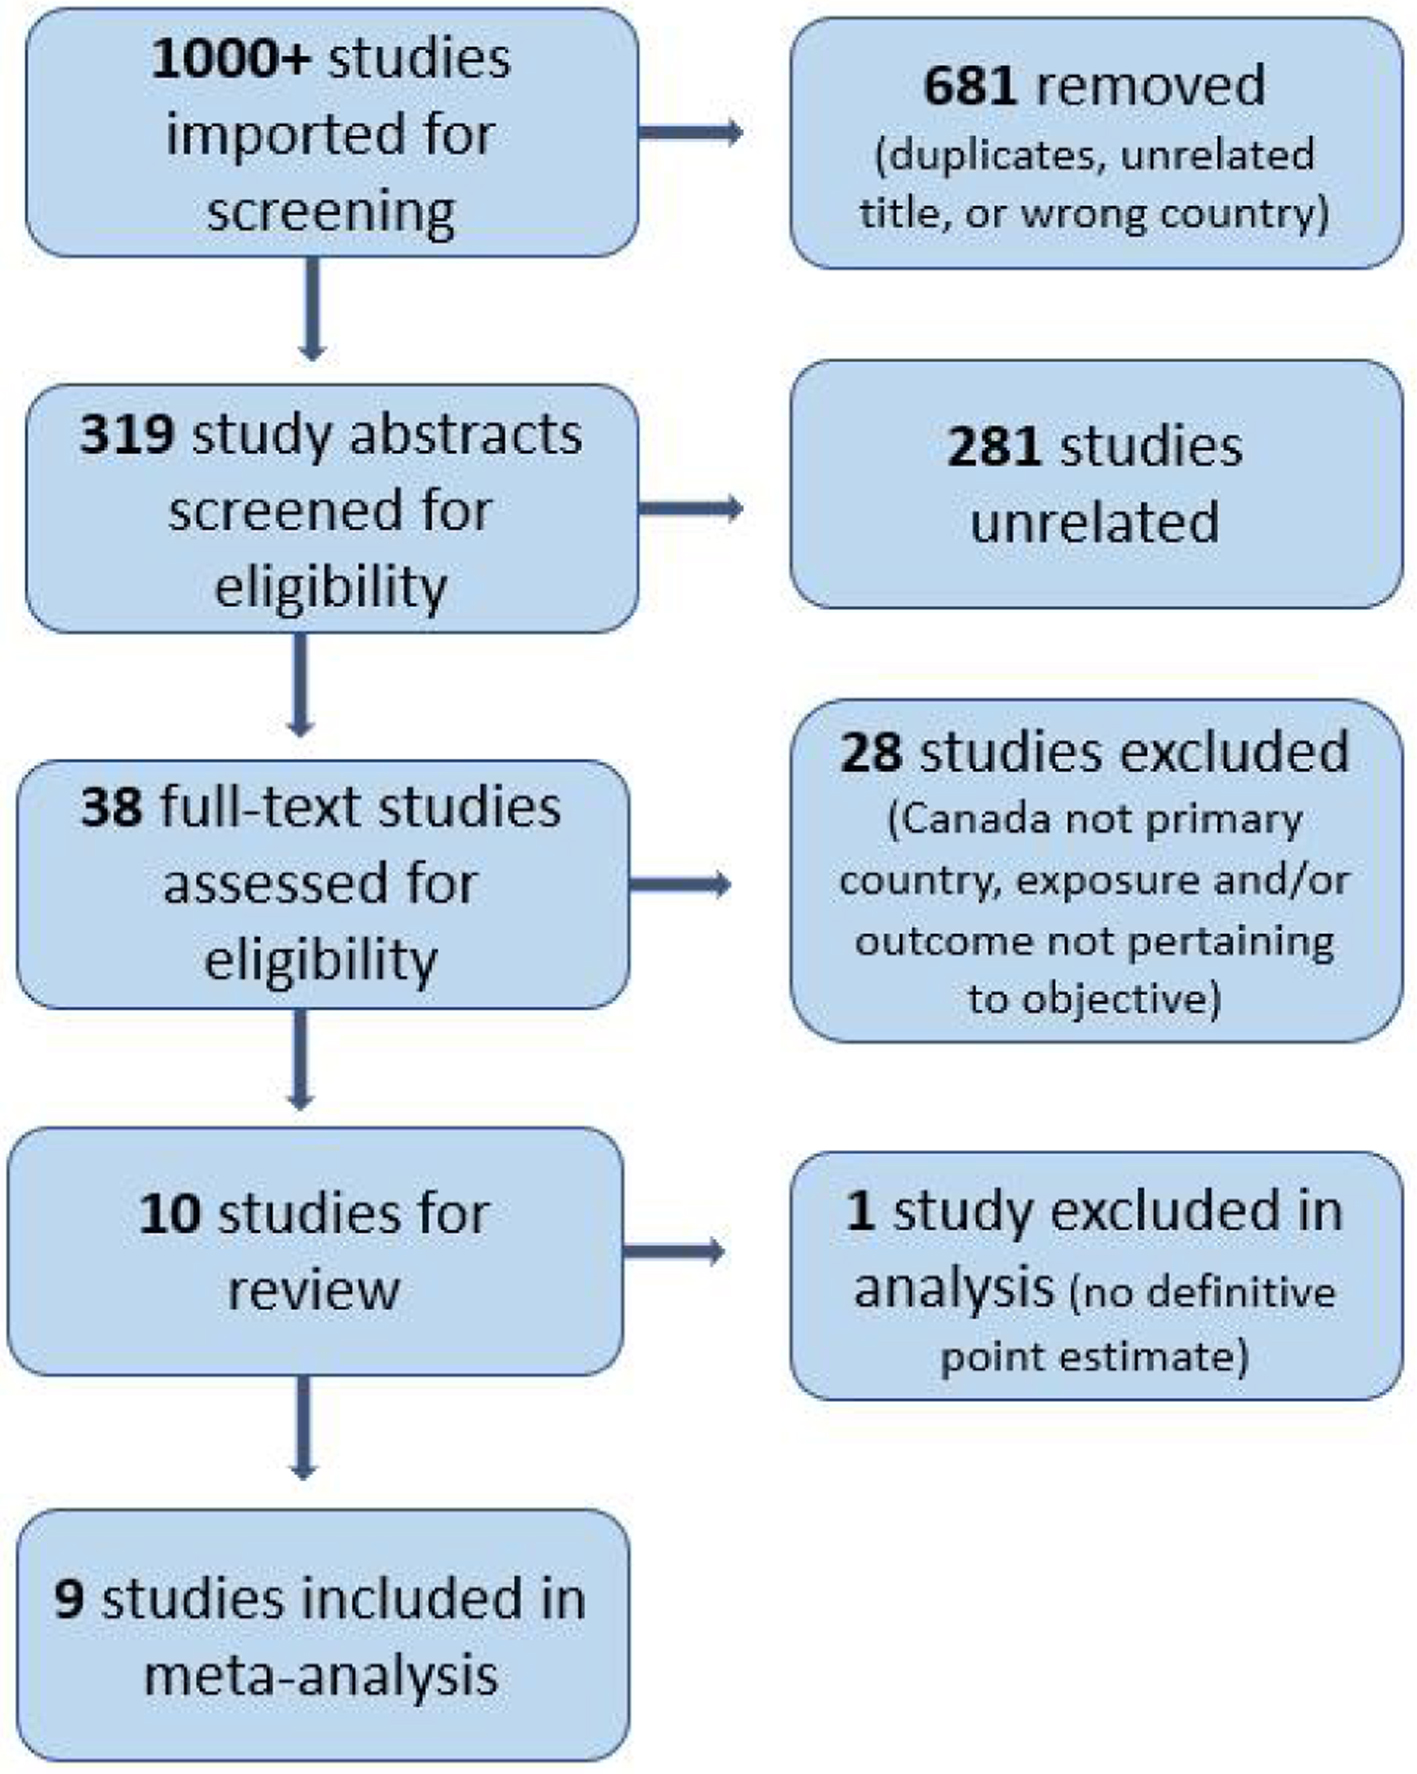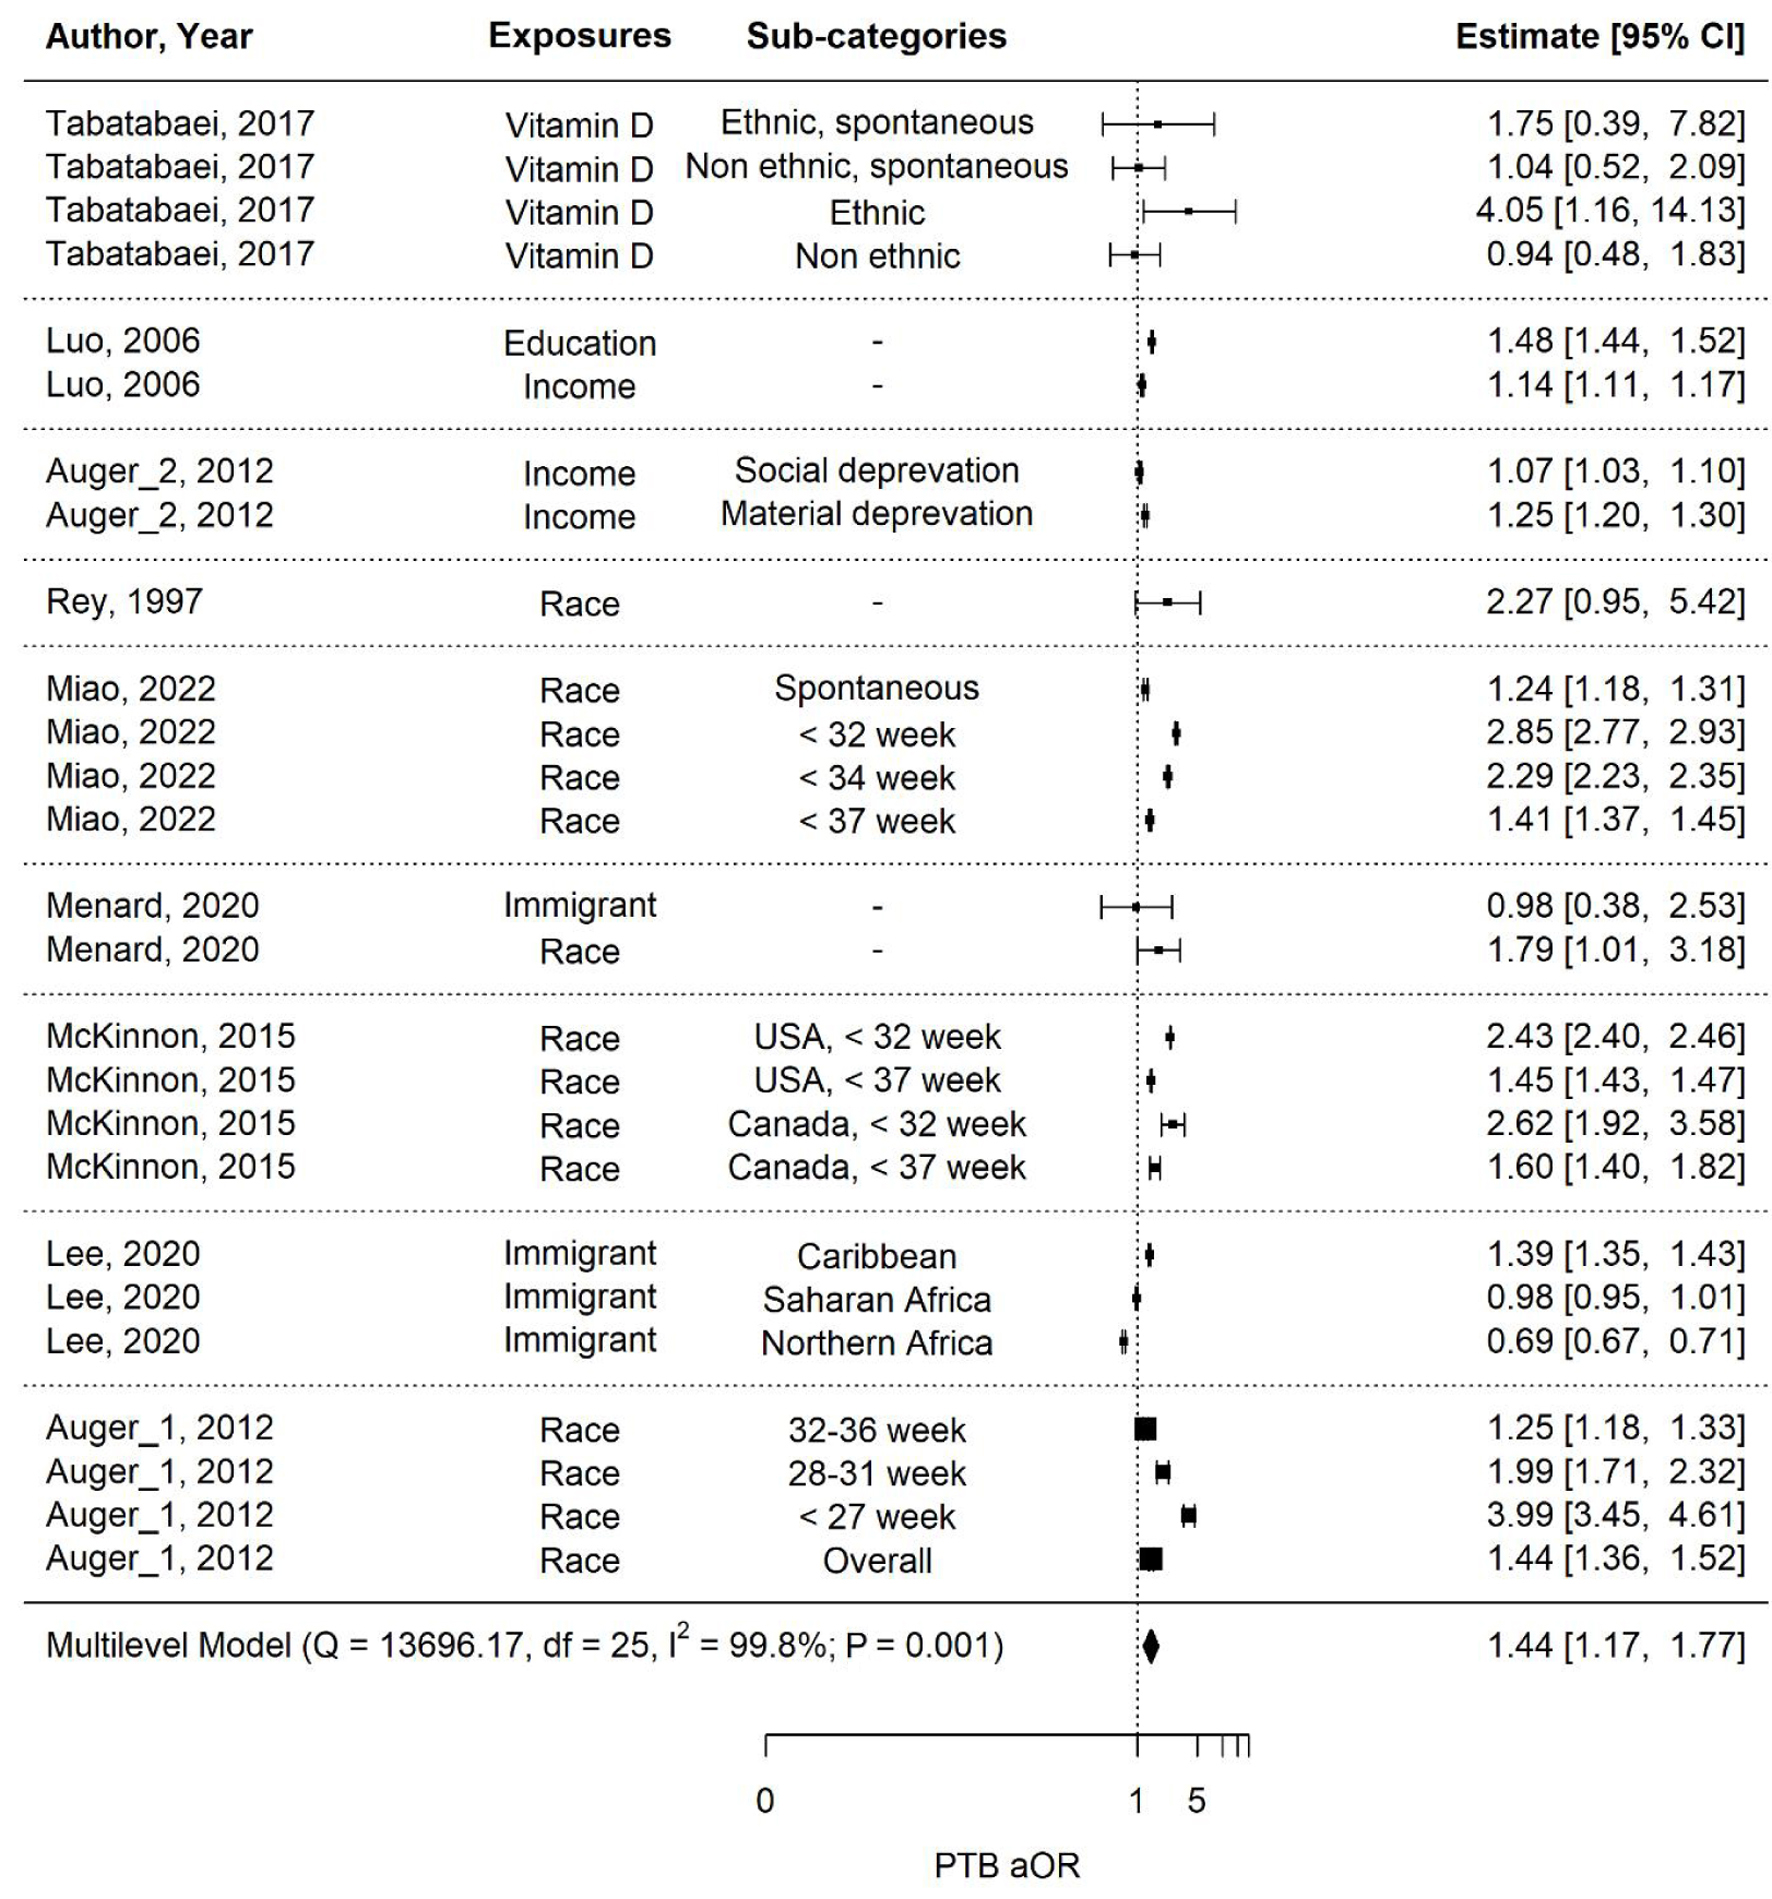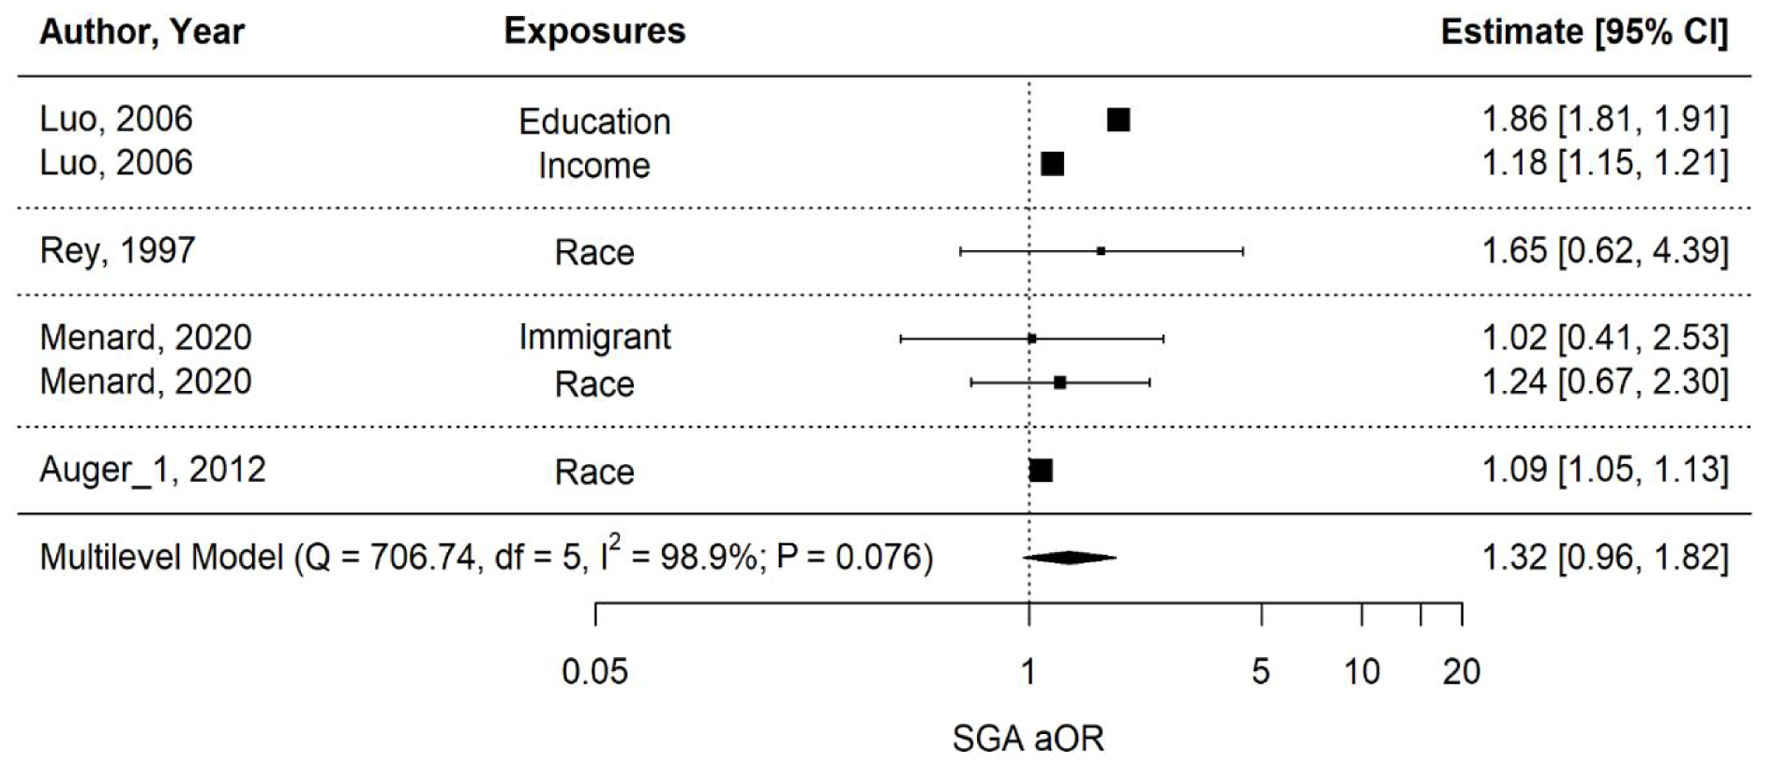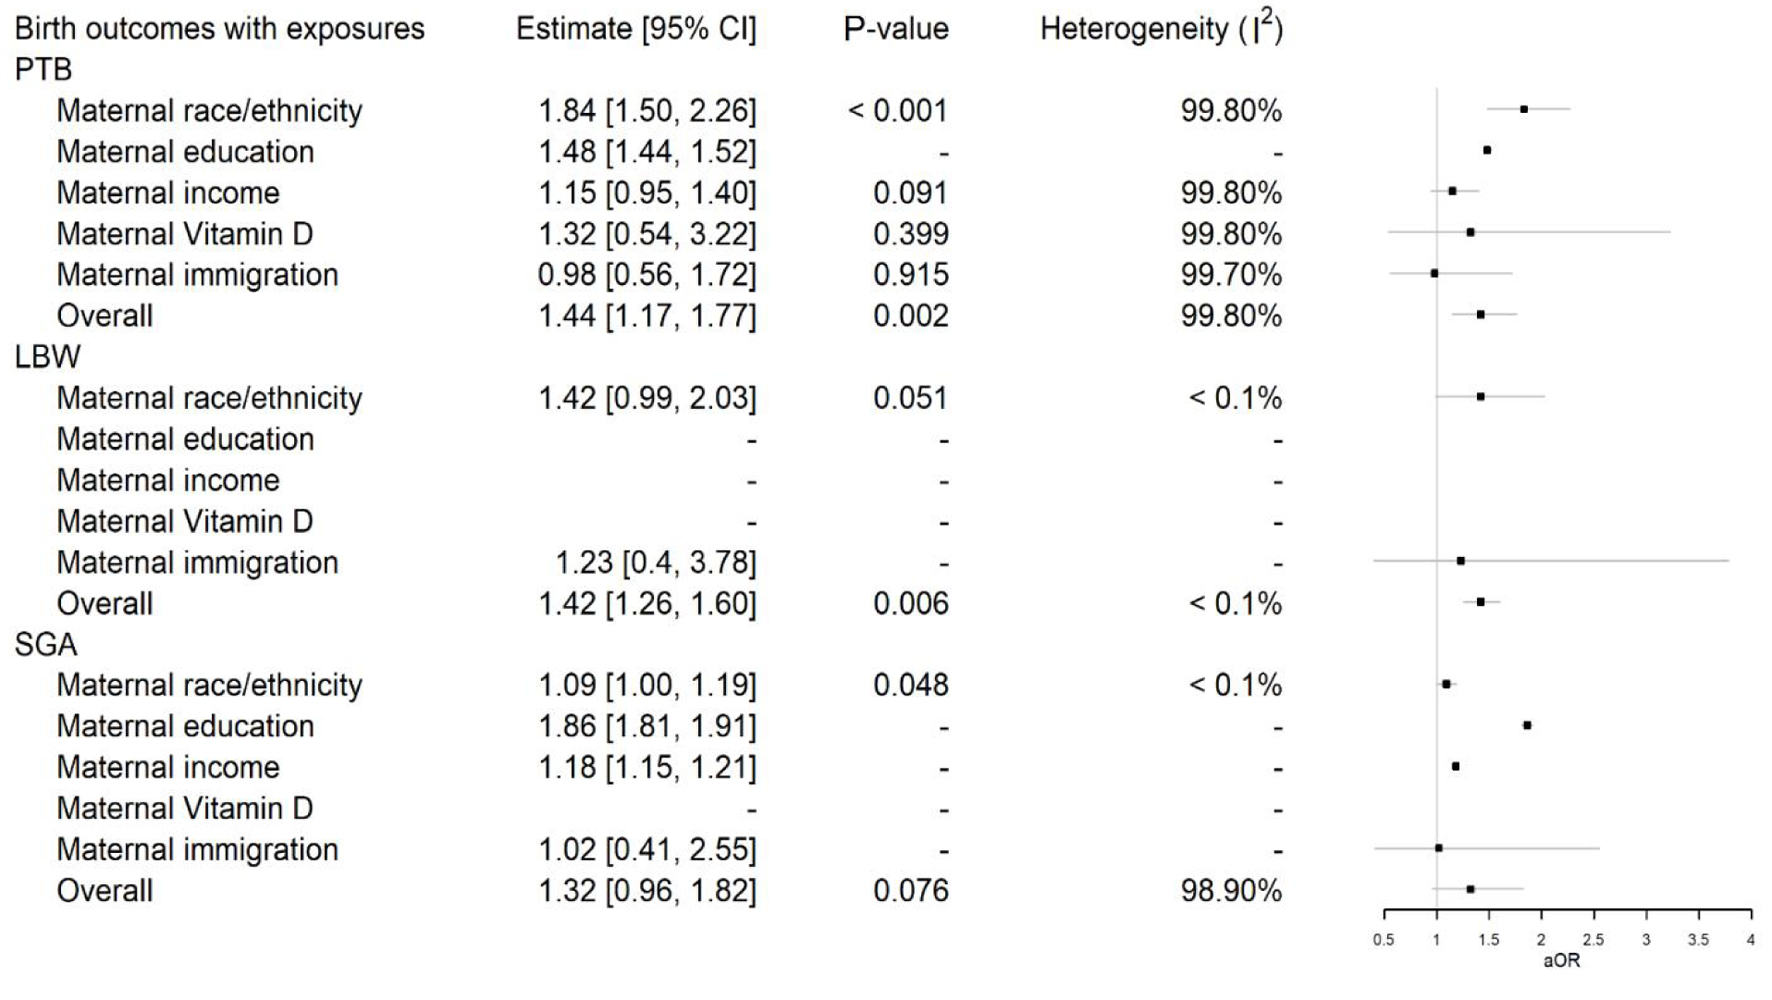
Figure 1. Preferred Reporting Items for Systematic Reviews and Meta-Analyses (PRISMA) flow chart.
| Journal of Clinical Gynecology and Obstetrics, ISSN 1927-1271 print, 1927-128X online, Open Access |
| Article copyright, the authors; Journal compilation copyright, J Clin Gynecol Obstet and Elmer Press Inc |
| Journal website https://www.jcgo.org |
Original Article
Volume 13, Number 3, December 2024, pages 59-74
Preterm Birth in Black Birthing People: A Systematic Literature Review and Meta-Analysis
Figures


Tables
| Source | Objective | Study design | Sample size (N) | Exposures | Outcomes | Result summary | Point estimates (95% confidence interval) |
|---|---|---|---|---|---|---|---|
| cHTN: chronic hypertension; CS: cesarean section; GDM: gestational diabetes; gHTN: gestational hypertension; HTN: hypertension; LBW: low birth weight (< 2,500 g); LGA: large for gestational age (> 90th percentile); OR: odds ratio; aOR: adjusted odds ratio; P: P-value; PE: preeclampsia; PTB: preterm birth; sPTB: spontaneous preterm birth; RR: relative risk; aRR: adjusted relative risk; SES: socioeconomic status; SGA: small for gestational age (< 10th percentile); US: United States; SII: slope index of inequality. | |||||||
| Auger et al (2011) [23], Quebec, Canada | To determine whether educational inequalities in PTB have increased in Quebec, Canada from 1981 to 2006 | Retrospective cohort study | N = 2,143,134 | Maternal education | PTB: extreme (< 27), very (28 - 31), or moderate (< 32 - 36 weeks gestation) | “Absolute differences in the PTB proportion between the least and most educated mothers increased from 1981 to 2006 for extreme (adjusted SII 0.11% vs. 0.28%) and moderate PTB (adjusted SII 1.67% vs. 3.11%). Absolute differences in the proportion very PTB did not increase” [19] | N/A - aOR estimates provided as a yearly trend |
| Auger et al (2012) [24], Quebec, Canada | To evaluate adverse birth outcomes for Haitians in Quebec, Canada from 1981 to 2006 | Retrospective cohort study | N = 2,143,134 Haitian: N = 31,663 Other Caribbean: N = 10,681 Other foreign: N = 230,692 Canadian: N = 1,841,396 | Maternal origin/ethnicity (Haitian-born vs. Canadian-born) | PTB: extreme (< 27), very (28 - 31), or moderate (< 32 - 36 weeks gestation) LBW (< 2,500 g) SGA (< 10%) | “Relative to Canadian-born mothers, odds for Haitian-born mothers were four times greater for extreme PTB (< 27 weeks), twice greater for very PTB (28 - 31 weeks), and 25% higher for moderate PTB (32 - 36 weeks). Patterns similar for SGA birth and severe cases of LBW.” | PTB: aOR 1.44 (1.36 - 1.52) Extreme: aOR 3.99 (3.45 - 4.61) Very: aOR 1.99 (1.70 - 2.31) Moderate: aOR 1.25 (1.18 - 1.33) LBW: aOR 1.42 (1.34 - 1.5) SGA birth: aOR 1.09 (1.05 - 1.14) |
| Auger et al (2012) [25], Quebec, Canada | To determine whether socioeconomic (material) area context is more strongly related to PTB than social area characteristics from 1999 to 2006 | Retrospective cohort study | N = 581,898 | Two composite indices representing area-level material and social deprivation | PTB (< 37 weeks gestation) | “PTB rates were higher for areas with high material (7.1%) and social (6.8%) deprivation than those with low material (5.5%) and social (5.9%) deprivation.” Adjusted hazards of PTB were greater for material deprivation than social deprivation. | Material deprivation: aHR 1.26 (1.21 - 1.31) Social deprivation: aHR 1.07 (1.03 - 1.11) |
| Lee et al (2020) [26], Canada | To describe provincial time trends and variations in birth outcomes according to the 20 top maternal birthplaces from 2000 to 2016 | Retrospective cohort study | N = 5,831,580 Immigrant: N = 1,562,835 Canadian-born: N = 4,268,745 | Immigrant vs. Canadian-born | PTB (22 to 36 weeks gestation) Mean birth weight (at 39 to 40 weeks gestation) | “Compared with PTB rates among Canadian-born mothers, PTB rates were lower among various Asian, African, and Western immigrant groups and higher among those from Bangladesh, the Philippines, and the Caribbean. Lower birth weights were seen for most source countries, except the United States. These differences were uniform across the provinces, with a few exceptions.” | Northern Africa: aRR 0.69 (0.67 - 0.72) Sub-Saharan Africa: aRR 0.98 (0.95 - 1.00) Caribbean: aRR 1.39 (1.35 - 1.42) |
| Luo et al (2006) [27], Quebec, Canada | To determine the extent to which associations between adverse birth outcomes and SES can be identified using individual vs. community-level measures between 1991 and 2000 | Retrospective cohort study | N = 825,349 | Individual-level (maternal education), community-level (neighborhood income) | PTB (< 37 weeks gestation) SGA (< 10th percentile) Stillbirth | Compared to women in highest income quintile, women in lowest quintile were significantly more likely to have PTB, SGA, or stillbirth. Compared to mothers who completed community college or some university, mothers who completed less than high school were significantly more likely to have PTB, SGA, or stillbirth. | Income (low vs. high quintile): PTB: aOR 1.14 (1.10 - 1.17) SGA: aOR 1.18 (1.15 - 1.21) Stillbirth: aOR 1.30 (1.13 - 1.48) Education (less than high school vs. community college/some university): PTB: aOR 1.48 (1.44 - 1.52) SGA: aOR 1.86 (1.82 - 1.91) Stillbirth: aOR 1.54 (1.36 - 1.74) |
| McKinnon et al (2015) [28], Canada, United States | To compare differences in preterm birth between non-Hispanic Black and White women in Canada and the US from 2004 to 2006 | Retrospective cohort study | Canada: N = 91,045 Black: N = 3,811 White: N = 87,234 US: N = 5,069,267 Black: N = 1,039,642 White: N = 4,029,625 | Maternal race (Black vs. White) | PTB (< 37 weeks) Very PTB (< 32 weeks) | Adjusted risk ratios for PTB were slightly higher in Canada than in the US whereas adjusted risk differences were similar in both countries (P = 1.0). Similar patterns were observed for racial disparities in very PTB. | PTB: Canada: aRR 1.60 (1.39 - 1.81) US: aRR 1.45 (1.44 - 1.47) P = 0.1 Very PTB: Canada: 2.62 (1.83 - 3.41) US: 2.43 (2.36 - 2.52) P = 0.6 |
| Menard et al (2020) [29], Montreal, Quebec, Canada | To characterize the rate of adverse pregnancy outcomes in a multicultural group of low-income women between 2013 and 2015 | Retrospective cohort study | N = 1,387 Black: N = 418 White: N = 767 Asian: N = 202 | Maternal race (Black vs. White), ethnicity, and immigration status (immigrant- vs. Canadian-born) | PTB (< 37 weeks) LBW (< 2,500 g) SGA (< 10%) LGA infants (> 90%) GDM Anemia Hypertension | Black women had higher risk of PTB, anemia, and hypertension compared to White women. Other outcomes were non-significant between Black and White women. Immigrants showed an increased risk of maternal anemia compared to Canadian-born women but similar risk PTB. | Race: PTB: aOR 1.79 (1.01 - 3.19) GDM: aOR 0.94 (0.64 - 1.38) Anemia: aOR 1.74 (1.29 - 2.35) HTN: aOR 2.23 (1.18 - 4.21) LBW: aOR 1.73 (0.88 - 3.00) SGA: aOR 1.24 (0.67 - 2.30) LGA: aOR 0.78 (0.51 - 1.18) Immigrants: PTB: aOR 0.98 (0.38 - 2.53) GDM: aOR 0.97 (0.51 - 1.82) Anemia: aOR 1.85 (1.06 - 3.21) HTN: aOR 0.71 (0.28 - 1.78) LBW: aOR 1.23 (0.40 - 3.78) SGA: aOR 1.02 (0.41 - 2.52) LGA: aOR 1.42 (0.67 - 2.99) |
| Miao et al (2022) [30], Ontario, Canada | To examine the inequities in adverse perinatal outcomes between Black and White pregnant people in Ontario between 2012 and 2019 | Retrospective cohort study | N = 412,120 Black: N = 41,766 White: N = 370,344 | Maternal race (Black vs. White) | PTB (< 37, < 34, < 32 weeks gestation), and other various adverse perinatal outcomes | “Black people were at an increased risk of GDM, preeclampsia, placental abruption, PTB (< 37, < 34, < 32 weeks), spontaneous PTB, all cesarean sections, emergency CS, LBW (< 2,500 g, < 1,500 g), SGA (< 10th percentile, < 3rd percentile) neonates, 5-min Apgar score < 4 and < 7, NICU admission, and hyperbilirubinemia requiring treatment but had lower risks of elective CS, assisted vaginal delivery, episiotomy, 3rd and 4th degree perineal tears, macrosomia, LGA neonates, and arterial cord pH < 7.1, as compared with White people. No differences in risks of gHTN and placenta previa were observed between Black and White people.” | PTB: < 37 weeks: aRR 1.41 (1.37 - 1.44), < 34 weeks: aRR 2.29 (2.23 - 2.35), < 32 weeks: aRR 2.85 (2.78 - 2.92) Spontaneous preterm birth: aRR 1.24 (1.17 - 1.30) GDM: aRR 1.08 (1.04 - 1.13) PE: aRR 1.1 (1.05 - 1.14) Placental abruption: aRR 1.11 (1.00 - 1.22) All cesarean section: aRR 1.11 (1.09 - 1.12) Emergency cesarean section: aRR 1.42 (1.40 - 1.44) Elective cesarean section: aRR 0.91 (0.89 - 0.93) Assisted vaginal delivery: aRR 0.83 (0.79 - 0.87) Episiotomy: aRR 0.71 (0.67 - 0.76) 3rd and 4th degree perineal tears: aRR 0.72 (0.64 - 0.81) gHTN: aRR 1.01 (0.96 - 1.06) Placenta previa: aRR 1.02 (0.89 - 1.15) |
| Rey (1997) [31], Canada | To compare the incidence of preeclampsia and neonatal outcomes in white (born in Canada) and black (born in Haiti) women with mild chronic hypertension between 1978 and 1991 | Case-control study | Cases: N = 282 Black: N = 74 White: N = 208 Controls: N = 20,077 Black: N = 2,400 White: N = 17,677 | Maternal origin/race: black (Haitian-born) vs. white (Canadian-born) | Superimposed preeclampsia (siPEC) Perinatal mortality PTB (< 37 weeks gestation) SGA (< 10%) | “siPEC (32.4% vs. 14.9%; P < 0.01), perinatal mortality (9.5% vs. 2.9%; P < 0.05) and prematurity (32.4% vs. 19.7%; P < 0.05) were more frequent in Black than in White women with cHTN. Within both races, cHTN women with siPEC demonstrated higher rates of perinatal mortality and morbidity than controls. | cHTN women and race: siPEC: RR 2.7 (1.5 - 5.1) Perinatal mortality: RR 3.5 (1.1 - 10.9) PTB: RR 1.9 (1.1 - 3.5) SGA: RR 1.5 (0.7 - 3.0) |
| Tabatabaei et al (2017) [32], Quebec, Canada | To explore the relation between maternal plasma 25(OH)D concentration in the first trimester (8 -14 weeks of gestation) and the risk of preterm and spontaneous preterm births (< 37 weeks of gestation) by ethnicity | Case-control study | N = 472 Cases: N = 118 Controls: N = 354 | Maternal vitamin D level (< 50, 50 - 75, and > 75 nmol/L) (ethnic vs. non-ethnic) | PTB spontaneous PTB (< 37 weeks gestation) | “The distributions of maternal vitD status (< 50, 50 - 75, and > 75 nmol/L) were different in preterm and spontaneous PTB cases compared with controls but only in women of ethnic minority (P = 0.003 and 0.024, respectively). Among ethnic subgroups, sub-Saharan Africans (P = 0.030) and Arab-West Asians (P = 0.045) showed an inverse relation between maternal vitD status and the risk of PTB.” | Vitamin D level (30 vs. 75 nmol/L) PTB, non-ethnic: aOR 0.94 (0.48 - 1.82) PTB, ethnic: aOR 4.05 (1.16 - 14.12) sPTB, non-ethnic: aOR 1.04 (0.52 - 2.10) sPTB, ethnic: aOR 1.75 (0.39 - 7.79) |
| Author, year | Selection | Comparability | Outcome | Quality | |||||
|---|---|---|---|---|---|---|---|---|---|
| Representativeness of exposed cohort | Selection of non-exposed cohort same as exposed | Ascertainment of exposure | Demonstration of outcome of interest not part of beginning of study | Comparable for primary/secondary items (adjusted for confounders) | Assessment of outcomes | Follow-up long enough | Adequacy of follow-up cohorts | ||
| Good quality: 3 or 4 “yes” in selection domain AND 1 “yes” in comparability domain AND 2 or 3 “yes” in outcome/exposure domain; Fair quality: 2 “yes” in selection domain AND 1 “yes” in comparability domain AND 2 or 3 “yes” in outcome/exposure domain. Poor quality: 0 or 1 “yes” in selection domain OR 0 “yes” in comparability domain or 0 or 1 “yes” in outcome/exposure domain. Y: yes; N: no; U: uncertain. | |||||||||
| Auger et al (2011) [23] | Y | Y | Y | N | Y | Y | Y | Y | Good (7/8) |
| Auger et al (2012) [24] | Y | Y | Y | N | Y | Y | Y | Y | Good (7/8) |
| Auger et al (2012) [25] | Y | Y | Y | N | Y | Y | Y | Y | Good (7/8) |
| Lee et al (2020) [26] | Y | Y | Y | N | Y | Y | Y | Y | Good (7/8) |
| Luo et al (2006) [27] | Y | Y | Y | N | Y | Y | Y | Y | Good (7/8) |
| McKinnon et al (2015) [28] | Y | Y | Y | N | Y | Y | Y | Y | Good (7/8) |
| Menard et al (2020) [29] | N | Y | Y | N | Y | Y | Y | Y | Fair (6/8) |
| Miao et al (2022) [30] | U | Y | U | N | Y | Y | Y | Y | Poor (5/8) |
| Author, year | Selection | Comparability | Exposure | Quality | |||||
|---|---|---|---|---|---|---|---|---|---|
| Adequate case definition | Representativeness of cases | Selection of controls | Definition of controls | Comparable for primary/secondary items (adjusted for confounders) | Ascertainment of exposure | Same method for cases/controls | Non-response rate | ||
| Good quality: 3 or 4 stars in selection domain AND 1 star in comparability domain AND 2 or 3 stars in outcome/exposure domain; Fair quality: 2 stars in selection domain AND 1 star in comparability domain AND 2 or 3 stars in outcome/exposure domain. Poor quality: 0 or 1 star in selection domain OR 0 stars in comparability domain or 0 or 1 star in outcome/exposure domain. Y: yes; N: no; U: uncertain. | |||||||||
| Rey (1997) [31] | U | Y | Y | Y | Y | U | Y | U | Poor (5/8) |
| Tabatabaei et al (2017) [32] | Y | Y | Y | Y | Y | Y | Y | Y | Good (8/8) |